PreparED Study Materials

EPID 230: Psychological Measurements and Statistics
School: University of Arizona
Number of Notes and Study Guides Available: 0
Videos
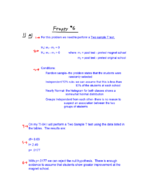
Probabilities with Poisson Variables X1 & X2

Want To Learn More? To watch the entire video and ALL of the videos in the series:
full solution
Explore the complexities of two independent Poisson random variables, X1 and X2, with means ?1 = 2 and ?2 = 3. Understand the process of calculating specific event probabilities and the application of the Poisson formula. Key takeaways include the manipulation and interpretation of these statistical values.
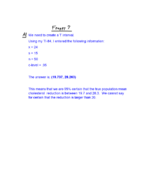
Estimating Study Hours: A 99% Confidence Method"
Want To Learn More? To watch the entire video and ALL of the videos in the series:
full solution
Explore how a university dean estimates freshmen study hours using statistical methods. Understand the importance of z-scores, confidence levels, and sample sizes in making accurate predictions. Learn how to ensure results are within a desired error margin.
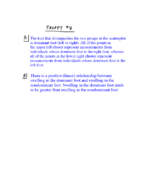
Actinomycin D's Impact on RNA Synthesis: An Experimental Insigh
Want To Learn More? To watch the entire video and ALL of the videos in the series:
full solution
Explore a biologist's experiment testing the effects of actinomycin D concentrations on RNA synthesis in cells. By analyzing the outcomes and calculating p-values, this video offers insights into how higher concentrations might inhibit normal RNA synthesis.
Analyzing Student Homework Times: Quartiles & Data Insights
Want To Learn More? To watch the entire video and ALL of the videos in the series:
full solution
Examine a dataset that tracks student homework durations. Understand quartiles, the interquartile range, and skewness in the data. Discover insights into typical study durations and outlier behaviors.
Cereal Box Weights: Z-Scores, Probabilities & Truth Behind Claims
Want To Learn More? To watch the entire video and ALL of the videos in the series:
full solution
Explore the intricacies of evaluating cereal box weights using Z-scores and normal distribution. By examining both individual boxes and a sample mean, understand the probabilities of achieving certain weight values. Gain insights into how statistical tools help interpret real-world product claims.
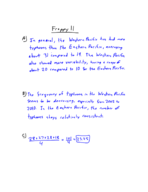
Comparing Stock Returns & Volatility: T-test and F-test Insights
Want To Learn More? To watch the entire video and ALL of the videos in the series:
full solution
Compare the mean returns and volatilities of two stocks using t-test and F-test methods. Through the application of hypothesis testing and P-value calculations, we determine which stock provides higher returns and which is riskier.