PreparED Study Materials

STAT 107: Survey of Statistics
School: University of Alaska
Number of Notes and Study Guides Available: 0
Videos
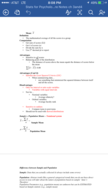
Evaluating Tornado Length Claims: A Statistical Breakdown

Want To Learn More? To watch the entire video and ALL of the videos in the series:
full solution
Explore a statistical approach to analyze the claim about average tornado lengths. Understand the nuances of hypothesis testing, from setting null and alternative hypotheses to interpreting P-values. Witness a comprehensive breakdown of the evidence from a sample of 500 tornadoes.
Analyzing Grade Variance: Is it More than Usual? A Chi-Square Test
Want To Learn More? To watch the entire video and ALL of the videos in the series:
full solution
Discover the process of analyzing variance in midterm grades with a Chi-Square test. Understand the significance of high variance and its implications. Follow along as we assess a professor's suspicion about unusually varied student performance.
Calculating Confidence Interval for Educational TV Viewership
Want To Learn More? To watch the entire video and ALL of the videos in the series:
full solution
Learn how to determine a 90% confidence interval for the proportion of people who watch educational television based on a survey. Understand how to utilize the z-score and interpret results, guiding decisions for a television company's publicity efforts.
Analyzing Ford F-750 Mileage Using Z-Scores & Probabilities
Want To Learn More? To watch the entire video and ALL of the videos in the series:
full solution
Explore how z-scores help analyze the mileage of Ford Super Duty F-750 trucks. Discover the percentages that reached specific mileage markers and grasp the significance of data using the z-table.
Car Theft Rates: Does Your Car Type Influence Risk?
Want To Learn More? To watch the entire video and ALL of the videos in the series:
full solution
Explore the relationship between specific car types and their theft rates. This video assesses correlations between car models like the Honda Accord, Toyota Camry, and others, emphasizing the difference between correlation and causation.
Young Adults' TV Habits: Decoding Mean and Probability
Want To Learn More? To watch the entire video and ALL of the videos in the series:
full solution
Discover how to determine the probability and mean of young adults watching TV in a week. Using provided data, we compare the sample mean with the calculated population mean to interpret expected TV viewing habits.