PreparED Study Materials

STAT 2123: Introduction to Econometrics
School: George Washington University
Number of Notes and Study Guides Available: 0
Videos
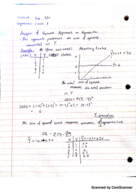
Analyzing Engineers' Graduate Plans: Fortune vs Engineering Horizons D

Want To Learn More? To watch the entire video and ALL of the videos in the series:
full solution
This video contrasts Fortune's claim about engineers pursuing further studies with data from Engineering Horizons. Utilizing hypothesis testing and confidence intervals, we assess the validity of Fortune's assertion within a statistical framework.
011 Car Colors in North America: Trends & Visual Insights
Want To Learn More? To watch the entire video and ALL of the videos in the series:
full solution
Discover the trends in car colors for North America in 2011. Break down the percentage distribution of various shades, from dominating whites to the less frequent greens. Understand the best visual techniques to represent this data, weighing the pros and cons of graphs.
Americans on Marriage: Statistical Insights from a Sample
Want To Learn More? To watch the entire video and ALL of the videos in the series:
full solution
Review a Pew Research Center study on Americans' beliefs about marriage. Through statistical analysis, understand the sampling distribution, standard deviation, and the probabilities surrounding various beliefs. The insights detail public sentiments and the significance of sample outcomes.
Eye Color & Assortative Mating in Scandinavian Couples
Want To Learn More? To watch the entire video and ALL of the videos in the series:
full solution
Explore the concept of assortative mating through an eye-color study of 204 Scandinavian couples. Discover how probabilities highlight nonrandom mating patterns. Conclude if eye colors of partners are independent or reveal assortative tendencies.
Decoding Probabilities: Unions, Intersections, and Complements
Want To Learn More? To watch the entire video and ALL of the videos in the series:
full solution
Explore the intricacies of calculating probabilities using set theory concepts such as union and intersection. With step-by-step computations, understand how to find the likelihood of events A and B occurring or not occurring together. Witness the application of classic probabilistic formulas.
Analyzing U.S. Teacher Salaries: Where Do You Stand?
Want To Learn More? To watch the entire video and ALL of the videos in the series:
full solution
Explore the salary distribution of U.S. teachers using statistical analysis. Understand the probabilities of different salary brackets and evaluate a potential job offer in the context of nationwide data.