PreparED Study Materials

STAT 341: Statistical Data Analysis I
School: Colorado State University
Number of Notes and Study Guides Available: 0
Videos
Evaluating Tornado Length Claims: A Statistical Breakdown

Want To Learn More? To watch the entire video and ALL of the videos in the series:
full solution
Explore a statistical approach to analyze the claim about average tornado lengths. Understand the nuances of hypothesis testing, from setting null and alternative hypotheses to interpreting P-values. Witness a comprehensive breakdown of the evidence from a sample of 500 tornadoes.
Margin of Error: Decoding the Uncertainty in Estimates
Want To Learn More? To watch the entire video and ALL of the videos in the series:
full solution
Unravel the concept of the "margin of error" within the context of estimating children's exposure to lead-based paint. Through clear explanations, comprehend the importance of acknowledging uncertainty in statistical findings and how it represents a range for potential true values.
ACT Score Bet: Who Owes the Pizza? A 7.6% Chance Explained
Want To Learn More? To watch the entire video and ALL of the videos in the series:
full solution
Discover the friendly bet between Leona and Fred surrounding their ACT scores and who owes who a pizza. Using statistical principles like Z-scores and the normal distribution, we'll decipher the odds of one outperforming the other by 5 points.
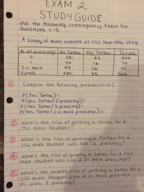
Computing Probabilities: College Students & Computer Ownership
Want To Learn More? To watch the entire video and ALL of the videos in the series:
full solution
Understand the probabilities of computer ownership among university first-year students through various scenarios. This video breaks down calculations for chances of ownership and non-ownership among random groups.
Two-Sample T-Test: Analyzing Control vs. Supplemented Groups
Want To Learn More? To watch the entire video and ALL of the videos in the series:
full solution
Explore the steps to conduct a two-sample t-test using a control and supplemented group. Through hypothesis testing, standard deviation, and P-value interpretation, we analyze the means of both groups to determine statistical differences.
Let Y be a random variable with mean 11 and variance 9
Want To Learn More? To watch the entire video and ALL of the videos in the series:
full solution