PreparED Study Materials

STAT 301: Intro to Statistics
School: University of Wisconsin - Madison
Number of Notes and Study Guides Available: 7
Notes
Videos
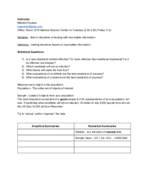
Understanding Null vs Alternative Hypotheses in Real-world Scenarios

Want To Learn More? To watch the entire video and ALL of the videos in the series:
full solution
Explore various scenarios and understand the fundamental principles of the null and alternative hypotheses in statistical testing. This video breaks down how these hypotheses represent current beliefs and potential deviations, aiding in the interpretation of statistical findings.
Which Confidence Level Produces the Widest Interval? Explained!
Want To Learn More? To watch the entire video and ALL of the videos in the series:
full solution
Uncover the relationship between confidence levels and interval widths. Grasp how the range of confidence intervals broadens with increasing confidence. Understand the trade-offs in statistical certainty and estimation.
011 Car Colors in North America: Trends & Visual Insights
Want To Learn More? To watch the entire video and ALL of the videos in the series:
full solution
Discover the trends in car colors for North America in 2011. Break down the percentage distribution of various shades, from dominating whites to the less frequent greens. Understand the best visual techniques to represent this data, weighing the pros and cons of graphs.
Poisson Distribution in Event Count & Uranium Discovery
Want To Learn More? To watch the entire video and ALL of the videos in the series:
full solution
Explore the dynamics of Poisson distribution using both theoretical understanding and a practical application related to discovering uranium deposits. With the help of Bayes' formula and parameter adjustments, interpret various probabilities and outcomes for event occurrences.
42.1 Web Visits: How It Stacks Up to U.S. Average
Want To Learn More? To watch the entire video and ALL of the videos in the series:
full solution
Explore how hypothesis testing is used to compare a sample mean of Internet visits to the national average. Through calculations and statistical analysis, we determine if a sample of users' web usage significantly deviates from the average U.S. web usage.
ACT Score Bet: Who Owes the Pizza? A 7.6% Chance Explained
Want To Learn More? To watch the entire video and ALL of the videos in the series:
full solution
Discover the friendly bet between Leona and Fred surrounding their ACT scores and who owes who a pizza. Using statistical principles like Z-scores and the normal distribution, we'll decipher the odds of one outperforming the other by 5 points.