PreparED Study Materials

STAT 309: Intro to Prob & Math STAT
School: University of Wisconsin - Madison
Number of Notes and Study Guides Available: 1
Notes
Videos
Evaluating Expressions Using a Set of Scores

Want To Learn More? To watch the entire video and ALL of the videos in the series:
full solution
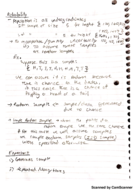
Discover the methodology behind evaluating various mathematical expressions using a given set of scores. By interpreting and applying summation notation, learn how to compute the desired results from a set of numbers. Key conclusions showcase the step-by-step calculations and their significance.
Poisson Analysis: Asthma ED Visits in Seattle
Want To Learn More? To watch the entire video and ALL of the videos in the series:
full solution
Unpack a Seattle-based study on Emergency Department asthma visits using the Poisson distribution. Explore the probability of visit frequencies and derive insights on healthcare patterns. Conclusions provide a statistical overview of asthma-related ED attendance.
Calculating Mean & Modal Class for Million-Dollar Bonuses
Want To Learn More? To watch the entire video and ALL of the videos in the series:
full solution
Learn how to determine the mean and modal class for bonuses in millions. Understand midpoint calculations and how frequencies impact results. Gain insights into bonus distributions in the financial realm.
Analyzing Teen Texting: Confidence Interval & Plausibility
Want To Learn More? To watch the entire video and ALL of the videos in the series:
full solution
Discover how to calculate the 95% confidence interval for a population proportion using sample data. Through a practical example about texting habits among American teens, learn the implications of this statistical tool and how to assess plausibility.
Committee Selection: Breaking Down Probabilities
Want To Learn More? To watch the entire video and ALL of the videos in the series:
full solution
Uncover the mathematical methods used to determine various probabilities when selecting committees. Utilize combination formulas and probabilities to evaluate different teacher-parent combinations.
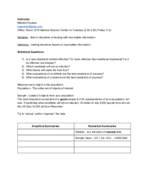
Actinomycin D's Impact on RNA Synthesis: An Experimental Insigh
Want To Learn More? To watch the entire video and ALL of the videos in the series:
full solution
Explore a biologist's experiment testing the effects of actinomycin D concentrations on RNA synthesis in cells. By analyzing the outcomes and calculating p-values, this video offers insights into how higher concentrations might inhibit normal RNA synthesis.