PreparED Study Materials

Notes
Videos
Computers in Schools: Probabilities & Distributions

Want To Learn More? To watch the entire video and ALL of the videos in the series:
full solution
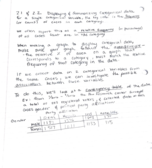
Assess the distribution of computers across schools using statistical methods. Determine the probability of a randomly selected school having a specific number of computers. From fewer than 50 to more than 100 computers, derive insightful conclusions about school infrastructures.
U.S. Adult Satisfaction in 2010: Confidence Interval Analysis
Want To Learn More? To watch the entire video and ALL of the videos in the series:
full solution
Discover how to construct a confidence interval for understanding U.S. adult satisfaction. Using a sample from a 2010 Gallup Poll, we unveil the proportion of adults pleased with the state of affairs, backed by statistical calculations.
Comparing Stock Returns & Volatility: T-test and F-test Insights
Want To Learn More? To watch the entire video and ALL of the videos in the series:
full solution
Compare the mean returns and volatilities of two stocks using t-test and F-test methods. Through the application of hypothesis testing and P-value calculations, we determine which stock provides higher returns and which is riskier.
Predicting Preference: Using Binomial Distribution for a New Dairy For
Want To Learn More? To watch the entire video and ALL of the videos in the series:
full solution
Discover how the binomial distribution formula can predict the preference of judges for a new dairy drink formula. Understand the odds of different outcomes from unanimous approval to complete rejection. Dive into probability, expectations, and variance to decode consumer choices.
Testing the Claim: Is Soft Drink Consumption Really 52 Gallons?
Want To Learn More? To watch the entire video and ALL of the videos in the series:
full solution
Discover the process of using a one-sample t-test to validate a claim about average soft drink consumption. By calculating the test statistic and analyzing the corresponding P-value, we determine the validity of the researcher's assertion.
Assumptions in Statistics: A High School Age Distribution Error
Want To Learn More? To watch the entire video and ALL of the videos in the series:
full solution
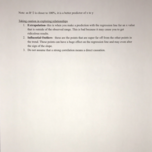
Analyze the statistical assumptions made about high school students' ages, emphasizing the importance of understanding distributions before applying the Standard Normal Table.