PreparED Study Materials

Notes
Videos
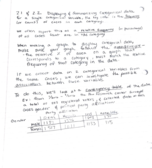
Arranging Talent: Math Behind Performance Sequences

Want To Learn More? To watch the entire video and ALL of the videos in the series:
full solution
Explore the fascinating world of permutations to determine the number of possible arrangements for a talent show. Learn how constraints change the number of valid sequences and delve into combinatorial techniques.
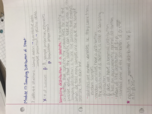
Analyzing U.S. Teacher Salaries: Where Do You Stand?
Want To Learn More? To watch the entire video and ALL of the videos in the series:
full solution
Explore the salary distribution of U.S. teachers using statistical analysis. Understand the probabilities of different salary brackets and evaluate a potential job offer in the context of nationwide data.
Real Cowboys' Lifespan: Debunking Wild West Myths
Want To Learn More? To watch the entire video and ALL of the videos in the series:
full solution
Explore the actual longevity of legendary cowboys using a detailed sociological study. With data visualization and historical references, challenge popular stereotypes and understand the reality of cowboy lives in the late 19th century.
Understanding Mutually Exclusive Events: Real-life Scenarios
Want To Learn More? To watch the entire video and ALL of the videos in the series:
full solution
Explore the concept of mutually exclusive events in probability, using practical examples like rolling a die, selecting college students, and understanding political party registrations.
Committee Selection: Breaking Down Probabilities
Want To Learn More? To watch the entire video and ALL of the videos in the series:
full solution
Uncover the mathematical methods used to determine various probabilities when selecting committees. Utilize combination formulas and probabilities to evaluate different teacher-parent combinations.
Crunching Car Sales Data: Size, Color, and Probability Insights
Want To Learn More? To watch the entire video and ALL of the videos in the series:
full solution
Uncover the likelihood of different car combinations by size and color from a dealer's sales data. Learn how to calculate probabilities, from the chances of a small car being black to the odds a non-small car isn't gray. An insightful look into understanding car preferences.