PreparED Study Materials

Videos
Real Cowboys' Lifespan: Debunking Wild West Myths

Want To Learn More? To watch the entire video and ALL of the videos in the series:
full solution
Explore the actual longevity of legendary cowboys using a detailed sociological study. With data visualization and historical references, challenge popular stereotypes and understand the reality of cowboy lives in the late 19th century.
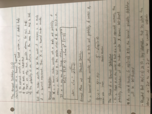
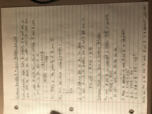
Uniform Data: Probabilities of Sample Means
Want To Learn More? To watch the entire video and ALL of the videos in the series:
full solution
This video offers a comprehensive look into the discrete uniform population, analyzing a sample size of 54 selected with replacement. Through calculated steps, viewers learn how to determine probabilities for a sample mean within specified limits. Utilizing Z-scores and standard normal tables, the session illuminates statistical principles in real-world scenarios.
Testing the 123-Gallon Daily Water Claim: Fact or Fiction?
Want To Learn More? To watch the entire video and ALL of the videos in the series:
full solution
Explore the claim that average daily water consumption is 123 gallons. Using statistical testing, we evaluate a new sample against the Old Farmer’s Almanac claim. Learn how to interpret p-values and t-scores in hypothesis testing.
ACT Score Bet: Who Owes the Pizza? A 7.6% Chance Explained
Want To Learn More? To watch the entire video and ALL of the videos in the series:
full solution
Discover the friendly bet between Leona and Fred surrounding their ACT scores and who owes who a pizza. Using statistical principles like Z-scores and the normal distribution, we'll decipher the odds of one outperforming the other by 5 points.
Calcium in Chautauqua's Rain: 1990 vs. 2010 Analysis
Want To Learn More? To watch the entire video and ALL of the videos in the series:
full solution
Explore the calcium concentration in Chautauqua's rainwater from 2010, comparing it to 1990 levels. Using statistical tests, examine normal distribution and determine significant changes. The results provide insights into environmental shifts over two decades.
42.1 Web Visits: How It Stacks Up to U.S. Average
Want To Learn More? To watch the entire video and ALL of the videos in the series:
full solution
Explore how hypothesis testing is used to compare a sample mean of Internet visits to the national average. Through calculations and statistical analysis, we determine if a sample of users' web usage significantly deviates from the average U.S. web usage.