PreparED Study Materials

Notes
Videos
Lake Macatawa Bacteria: 90% Confidence Analysis

Want To Learn More? To watch the entire video and ALL of the videos in the series:
full solution
Discover the method to analyze bacteria colonies in Lake Macatawa's east basin. Using 30 samples, we compute a 90% confidence interval for the mean colony count. Learn the steps of statistical analysis in environmental studies.
Cereal Box Weights: Z-Scores, Probabilities & Truth Behind Claims
Want To Learn More? To watch the entire video and ALL of the videos in the series:
full solution
Explore the intricacies of evaluating cereal box weights using Z-scores and normal distribution. By examining both individual boxes and a sample mean, understand the probabilities of achieving certain weight values. Gain insights into how statistical tools help interpret real-world product claims.
Analyzing Ford F-750 Mileage Using Z-Scores & Probabilities
Want To Learn More? To watch the entire video and ALL of the videos in the series:
full solution
Explore how z-scores help analyze the mileage of Ford Super Duty F-750 trucks. Discover the percentages that reached specific mileage markers and grasp the significance of data using the z-table.
U.S. Adult Satisfaction in 2010: Confidence Interval Analysis
Want To Learn More? To watch the entire video and ALL of the videos in the series:
full solution
Discover how to construct a confidence interval for understanding U.S. adult satisfaction. Using a sample from a 2010 Gallup Poll, we unveil the proportion of adults pleased with the state of affairs, backed by statistical calculations.
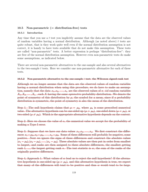
Brand X vs. Brand Y: 95% Confidence in Voltage Difference
Want To Learn More? To watch the entire video and ALL of the videos in the series:
full solution
Compare the voltages of Brand X and Brand Y batteries using statistical analysis. Learn how to determine a 95% confidence interval for their mean differences. Understand the process from data collection to interpretation of results.
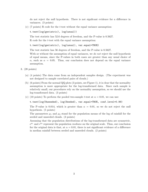
Analyzing Grade Variance: Is it More than Usual? A Chi-Square Test
Want To Learn More? To watch the entire video and ALL of the videos in the series:
full solution
Discover the process of analyzing variance in midterm grades with a Chi-Square test. Understand the significance of high variance and its implications. Follow along as we assess a professor's suspicion about unusually varied student performance.