PreparED Study Materials

Notes
Videos
Calcium in Chautauqua's Rain: 1990 vs. 2010 Analysis

Want To Learn More? To watch the entire video and ALL of the videos in the series:
full solution
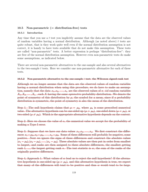
Explore the calcium concentration in Chautauqua's rainwater from 2010, comparing it to 1990 levels. Using statistical tests, examine normal distribution and determine significant changes. The results provide insights into environmental shifts over two decades.
Chi-Square Observations: Probability of Exceeding 7.779
Want To Learn More? To watch the entire video and ALL of the videos in the series:
full solution
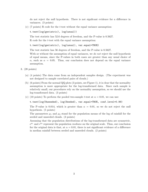
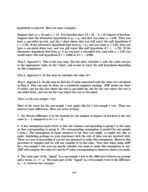
Discover how to compute the likelihood of observations exceeding a certain value in a chi-square distribution with 4 degrees of freedom. Using the binomial distribution formula, evaluate the chances of at most 3 out of 15 observations surpassing the 7.779 mark. Results highlight the intricacies of data distributions.
Lake Macatawa Bacteria: 90% Confidence Analysis
Want To Learn More? To watch the entire video and ALL of the videos in the series:
full solution
Discover the method to analyze bacteria colonies in Lake Macatawa's east basin. Using 30 samples, we compute a 90% confidence interval for the mean colony count. Learn the steps of statistical analysis in environmental studies.
Comparing Plastic Gear Strengths: Supplier 1 vs. Supplier 2 Analysis
Want To Learn More? To watch the entire video and ALL of the videos in the series:
full solution
This video presents a comparison between two suppliers of plastic gears in terms of their mean impact strength. Using statistical tools like the two-sample t-test and confidence intervals, we evaluate which supplier offers stronger gears.
Traffic Light Wait Time: Using Probability to Decode Delays
Want To Learn More? To watch the entire video and ALL of the videos in the series:
full solution
Explore the mathematical intricacies behind calculating the waiting time for a motorist at traffic lights. Learn about normal random variables, conditional probabilities, and the challenges in determining specific waiting durations.
Exit Poll Analysis: Education Funding Referendum Votes
Want To Learn More? To watch the entire video and ALL of the videos in the series:
full solution
Explore the application of proportion z-tests in analyzing exit polling data. Understand how to determine the likelihood of sample results given a population proportion. Recognize the importance of considering non-sampling errors in interpreting exit poll outcomes.