PreparED Study Materials

Notes
Videos
Young Adults' TV Habits: Decoding Mean and Probability

Want To Learn More? To watch the entire video and ALL of the videos in the series:
full solution
Discover how to determine the probability and mean of young adults watching TV in a week. Using provided data, we compare the sample mean with the calculated population mean to interpret expected TV viewing habits.
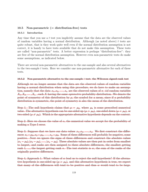
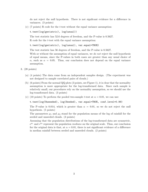
Evaluating Expressions Using a Set of Scores
Want To Learn More? To watch the entire video and ALL of the videos in the series:
full solution
Discover the methodology behind evaluating various mathematical expressions using a given set of scores. By interpreting and applying summation notation, learn how to compute the desired results from a set of numbers. Key conclusions showcase the step-by-step calculations and their significance.
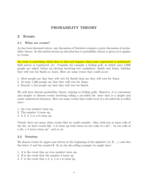
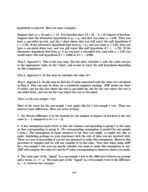
Decoding Probabilities: Unions, Intersections, and Complements
Want To Learn More? To watch the entire video and ALL of the videos in the series:
full solution
Explore the intricacies of calculating probabilities using set theory concepts such as union and intersection. With step-by-step computations, understand how to find the likelihood of events A and B occurring or not occurring together. Witness the application of classic probabilistic formulas.
Confidence Intervals for Bag Weights: A Statistical Guide
Want To Learn More? To watch the entire video and ALL of the videos in the series:
full solution
Understand the process of determining the 94.26% confidence interval for the median weight of "80-pound" bags of water softener pellets using a standard normal table and specified formulas. Additionally, explore the steps to deduce a confidence level of 90.47%.
Car Theft Rates: Does Your Car Type Influence Risk?
Want To Learn More? To watch the entire video and ALL of the videos in the series:
full solution
Explore the relationship between specific car types and their theft rates. This video assesses correlations between car models like the Honda Accord, Toyota Camry, and others, emphasizing the difference between correlation and causation.
Computers in Schools: Probabilities & Distributions
Want To Learn More? To watch the entire video and ALL of the videos in the series:
full solution
Assess the distribution of computers across schools using statistical methods. Determine the probability of a randomly selected school having a specific number of computers. From fewer than 50 to more than 100 computers, derive insightful conclusions about school infrastructures.