PreparED Study Materials

MAT 231: Statistics for Biosciences
School: Arizona State University
Number of Notes and Study Guides Available: 13
Notes


Videos
Poisson Distribution in Event Count & Uranium Discovery

Want To Learn More? To watch the entire video and ALL of the videos in the series:
full solution
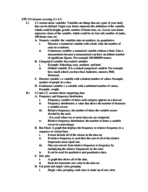
Explore the dynamics of Poisson distribution using both theoretical understanding and a practical application related to discovering uranium deposits. With the help of Bayes' formula and parameter adjustments, interpret various probabilities and outcomes for event occurrences.
Two-Sample T-Test: Analyzing Control vs. Supplemented Groups
Want To Learn More? To watch the entire video and ALL of the videos in the series:
full solution
Explore the steps to conduct a two-sample t-test using a control and supplemented group. Through hypothesis testing, standard deviation, and P-value interpretation, we analyze the means of both groups to determine statistical differences.
Job Trends Analysis: Normal Approximation & Z-Values
Want To Learn More? To watch the entire video and ALL of the videos in the series:
full solution
Explore the nuances of determining the likelihood of specific employment patterns using statistical methods. Understand the application of the normal approximation to the binomial distribution and the role of z-values in probability determinations. Gain clarity on interpreting employment trends with the help of a standard normal table.
Buteyko Breathing's Impact on Asthma: A Study Analysis
Want To Learn More? To watch the entire video and ALL of the videos in the series:
full solution
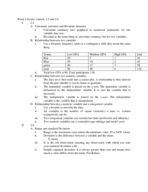
In this video, we examine the Buteyko method's impact on asthma symptoms using a study of 600 patients. Participants were divided into two groups, one practicing the technique and the other not. The Buteyko group showed significant improvement in life quality and symptom reduction.
Thread Strength After Heat Treatment: A 99% Confidence Analysis"
Want To Learn More? To watch the entire video and ALL of the videos in the series:
full solution
Explore the impact of heat treatment duration on thread breaking strength. Using statistical analysis, we assess the difference in mean strengths between batches. Confidence intervals help quantify this difference with 99% certainty.
Estimating Study Hours: A 99% Confidence Method"
Want To Learn More? To watch the entire video and ALL of the videos in the series:
full solution
Explore how a university dean estimates freshmen study hours using statistical methods. Understand the importance of z-scores, confidence levels, and sample sizes in making accurate predictions. Learn how to ensure results are within a desired error margin.