PreparED Study Materials

Videos
Americans on Marriage: Statistical Insights from a Sample

Want To Learn More? To watch the entire video and ALL of the videos in the series:
full solution
Review a Pew Research Center study on Americans' beliefs about marriage. Through statistical analysis, understand the sampling distribution, standard deviation, and the probabilities surrounding various beliefs. The insights detail public sentiments and the significance of sample outcomes.
Analyzing U.S. Teacher Salaries: Where Do You Stand?
Want To Learn More? To watch the entire video and ALL of the videos in the series:
full solution
Explore the salary distribution of U.S. teachers using statistical analysis. Understand the probabilities of different salary brackets and evaluate a potential job offer in the context of nationwide data.
ACT Score Bet: Who Owes the Pizza? A 7.6% Chance Explained
Want To Learn More? To watch the entire video and ALL of the videos in the series:
full solution
Discover the friendly bet between Leona and Fred surrounding their ACT scores and who owes who a pizza. Using statistical principles like Z-scores and the normal distribution, we'll decipher the odds of one outperforming the other by 5 points.
2010 US Gas Prices: Insights with Chebyshev’s Inequality
Want To Learn More? To watch the entire video and ALL of the videos in the series:
full solution
Unpack the average US gasoline prices in December 2010 using Chebyshev’s Inequality. Discover the minimum percentage of gas stations within specific price deviations. Learn how prices ranged based on standard deviations from the mean.
Chi-Square Observations: Probability of Exceeding 7.779
Want To Learn More? To watch the entire video and ALL of the videos in the series:
full solution
Discover how to compute the likelihood of observations exceeding a certain value in a chi-square distribution with 4 degrees of freedom. Using the binomial distribution formula, evaluate the chances of at most 3 out of 15 observations surpassing the 7.779 mark. Results highlight the intricacies of data distributions.
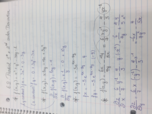
Evaluating Expressions Using a Set of Scores
Want To Learn More? To watch the entire video and ALL of the videos in the series:
full solution
Discover the methodology behind evaluating various mathematical expressions using a given set of scores. By interpreting and applying summation notation, learn how to compute the desired results from a set of numbers. Key conclusions showcase the step-by-step calculations and their significance.