PreparED Study Materials
Notes

Videos
Analyzing Movie Habits Survey: Uncovering Hidden Biases

Want To Learn More? To watch the entire video and ALL of the videos in the series:
full solution
Unpack the potential biases in a survey about movie-watching habits based on its design and constraints. Learn how limiting to residential phones and specific time frames can affect results. Recommendations are made to ensure a broader, more accurate perspective.
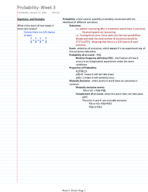
Let Y be a random variable with mean 11 and variance 9
Want To Learn More? To watch the entire video and ALL of the videos in the series:
full solution
Brand X vs. Brand Y: 95% Confidence in Voltage Difference
Want To Learn More? To watch the entire video and ALL of the videos in the series:
full solution
Compare the voltages of Brand X and Brand Y batteries using statistical analysis. Learn how to determine a 95% confidence interval for their mean differences. Understand the process from data collection to interpretation of results.
2010 US Gas Prices: Insights with Chebyshev’s Inequality
Want To Learn More? To watch the entire video and ALL of the videos in the series:
full solution
Unpack the average US gasoline prices in December 2010 using Chebyshev’s Inequality. Discover the minimum percentage of gas stations within specific price deviations. Learn how prices ranged based on standard deviations from the mean.
Two-Sample T-Test: Analyzing Control vs. Supplemented Groups
Want To Learn More? To watch the entire video and ALL of the videos in the series:
full solution
Explore the steps to conduct a two-sample t-test using a control and supplemented group. Through hypothesis testing, standard deviation, and P-value interpretation, we analyze the means of both groups to determine statistical differences.
Calculating Mean & Modal Class for Million-Dollar Bonuses
Want To Learn More? To watch the entire video and ALL of the videos in the series:
full solution
Learn how to determine the mean and modal class for bonuses in millions. Understand midpoint calculations and how frequencies impact results. Gain insights into bonus distributions in the financial realm.