PreparED Study Materials

STAT 3128: STAT 3128
School: University of North Carolina - Charlotte
Number of Notes and Study Guides Available: 1
Notes
Videos
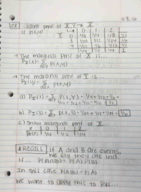
2010 US Gas Prices: Insights with Chebyshev’s Inequality

Want To Learn More? To watch the entire video and ALL of the videos in the series:
full solution
Unpack the average US gasoline prices in December 2010 using Chebyshev’s Inequality. Discover the minimum percentage of gas stations within specific price deviations. Learn how prices ranged based on standard deviations from the mean.
Calculating Confidence Interval for Educational TV Viewership
Want To Learn More? To watch the entire video and ALL of the videos in the series:
full solution
Learn how to determine a 90% confidence interval for the proportion of people who watch educational television based on a survey. Understand how to utilize the z-score and interpret results, guiding decisions for a television company's publicity efforts.
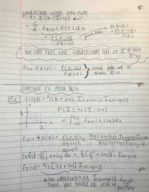
Poisson Analysis: Asthma ED Visits in Seattle
Want To Learn More? To watch the entire video and ALL of the videos in the series:
full solution
Unpack a Seattle-based study on Emergency Department asthma visits using the Poisson distribution. Explore the probability of visit frequencies and derive insights on healthcare patterns. Conclusions provide a statistical overview of asthma-related ED attendance.
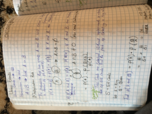
Comparing Stock Returns & Volatility: T-test and F-test Insights
Want To Learn More? To watch the entire video and ALL of the videos in the series:
full solution
Compare the mean returns and volatilities of two stocks using t-test and F-test methods. Through the application of hypothesis testing and P-value calculations, we determine which stock provides higher returns and which is riskier.
Comparing Plastic Gear Strengths: Supplier 1 vs. Supplier 2 Analysis
Want To Learn More? To watch the entire video and ALL of the videos in the series:
full solution
This video presents a comparison between two suppliers of plastic gears in terms of their mean impact strength. Using statistical tools like the two-sample t-test and confidence intervals, we evaluate which supplier offers stronger gears.
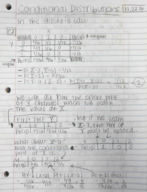
Understanding Delaware's Income Distribution: A Statistical Look
Want To Learn More? To watch the entire video and ALL of the videos in the series:
full solution
Analyze Delaware's per capita annual income using statistical methods. Understand the probabilities associated with various income levels for a sample of state residents. Learn to use the Z score formula for such evaluations.