PreparED Study Materials

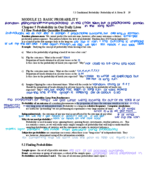
STA 2023: Introduction to Statistics 1
School: University of Florida
Number of Notes and Study Guides Available: 103
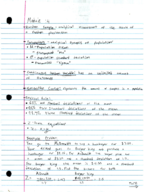
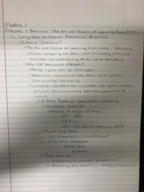
Notes


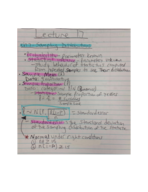


Study Guides


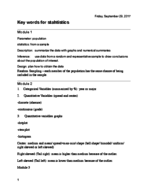


Videos
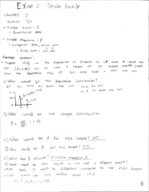
Young Adults' TV Habits: Decoding Mean and Probability

Want To Learn More? To watch the entire video and ALL of the videos in the series:
full solution
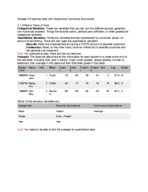
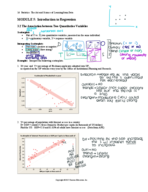
Discover how to determine the probability and mean of young adults watching TV in a week. Using provided data, we compare the sample mean with the calculated population mean to interpret expected TV viewing habits.
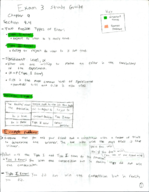
Committee Selection: Breaking Down Probabilities
Want To Learn More? To watch the entire video and ALL of the videos in the series:
full solution
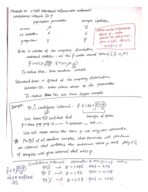
Uncover the mathematical methods used to determine various probabilities when selecting committees. Utilize combination formulas and probabilities to evaluate different teacher-parent combinations.
Actinomycin D's Impact on RNA Synthesis: An Experimental Insigh
Want To Learn More? To watch the entire video and ALL of the videos in the series:
full solution
Explore a biologist's experiment testing the effects of actinomycin D concentrations on RNA synthesis in cells. By analyzing the outcomes and calculating p-values, this video offers insights into how higher concentrations might inhibit normal RNA synthesis.
Poisson Distribution in Event Count & Uranium Discovery
Want To Learn More? To watch the entire video and ALL of the videos in the series:
full solution
Explore the dynamics of Poisson distribution using both theoretical understanding and a practical application related to discovering uranium deposits. With the help of Bayes' formula and parameter adjustments, interpret various probabilities and outcomes for event occurrences.
Battery Lifetimes: Mean, Variance & Standard Deviation
Want To Learn More? To watch the entire video and ALL of the videos in the series:
full solution
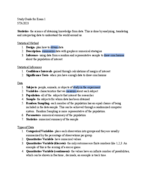
Discover the nuances of analyzing battery lifetime data through mean, variance, and standard deviation computations. Using class boundaries, midpoints, and frequencies, gain insights into the dispersion of battery lifespans and the average deviation from the mean.
Football Field Goal Probabilities: A Multi-Player Analysis
Want To Learn More? To watch the entire video and ALL of the videos in the series:
full solution
Discover the art of calculating probabilities in football. Using three players' success rates, we determine the odds of different goal outcomes. Understand independent and mutually exclusive events in a real-world scenario.