PreparED Study Materials

STAT 1221: Elements of STAT I
School: University of North Carolina - Charlotte
Number of Notes and Study Guides Available: 14
Notes


Study Guides


Videos
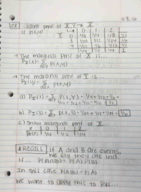
Evaluating Expressions Using a Set of Scores

Want To Learn More? To watch the entire video and ALL of the videos in the series:
full solution
Discover the methodology behind evaluating various mathematical expressions using a given set of scores. By interpreting and applying summation notation, learn how to compute the desired results from a set of numbers. Key conclusions showcase the step-by-step calculations and their significance.
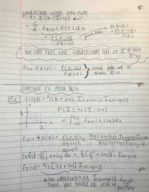
Testing the 123-Gallon Daily Water Claim: Fact or Fiction?
Want To Learn More? To watch the entire video and ALL of the videos in the series:
full solution
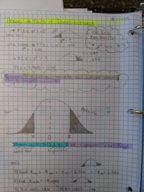
Explore the claim that average daily water consumption is 123 gallons. Using statistical testing, we evaluate a new sample against the Old Farmer’s Almanac claim. Learn how to interpret p-values and t-scores in hypothesis testing.
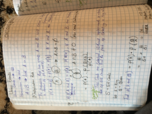
Job Trends Analysis: Normal Approximation & Z-Values
Want To Learn More? To watch the entire video and ALL of the videos in the series:
full solution
Explore the nuances of determining the likelihood of specific employment patterns using statistical methods. Understand the application of the normal approximation to the binomial distribution and the role of z-values in probability determinations. Gain clarity on interpreting employment trends with the help of a standard normal table.
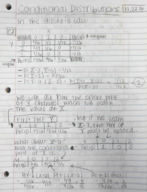
Reaction Times in Anderson's Study: Analyzing Central Tendencies
Want To Learn More? To watch the entire video and ALL of the videos in the series:
full solution
Explore Anderson's 1999 study on how attention load impacts reaction times. Through hands-on analysis, understand the computation of mean, median, and mode from the provided data. Highlighting the significance of the median in capturing the central tendency amidst potential outliers.
Crunching Car Sales Data: Size, Color, and Probability Insights
Want To Learn More? To watch the entire video and ALL of the videos in the series:
full solution
Uncover the likelihood of different car combinations by size and color from a dealer's sales data. Learn how to calculate probabilities, from the chances of a small car being black to the odds a non-small car isn't gray. An insightful look into understanding car preferences.
Analyzing Student Homework Times: Quartiles & Data Insights
Want To Learn More? To watch the entire video and ALL of the videos in the series:
full solution
Examine a dataset that tracks student homework durations. Understand quartiles, the interquartile range, and skewness in the data. Discover insights into typical study durations and outlier behaviors.