PreparED Study Materials

STAT 3123: Statistics and Probability II
School: University of North Carolina - Charlotte
Number of Notes and Study Guides Available: 0
Videos
Understanding Delaware's Income Distribution: A Statistical Look

Want To Learn More? To watch the entire video and ALL of the videos in the series:
full solution
Analyze Delaware's per capita annual income using statistical methods. Understand the probabilities associated with various income levels for a sample of state residents. Learn to use the Z score formula for such evaluations.
Reaction Times in Anderson's Study: Analyzing Central Tendencies
Want To Learn More? To watch the entire video and ALL of the videos in the series:
full solution
Explore Anderson's 1999 study on how attention load impacts reaction times. Through hands-on analysis, understand the computation of mean, median, and mode from the provided data. Highlighting the significance of the median in capturing the central tendency amidst potential outliers.
Traffic Light Wait Time: Using Probability to Decode Delays
Want To Learn More? To watch the entire video and ALL of the videos in the series:
full solution
Explore the mathematical intricacies behind calculating the waiting time for a motorist at traffic lights. Learn about normal random variables, conditional probabilities, and the challenges in determining specific waiting durations.
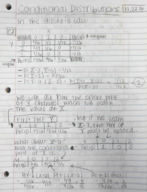
Poisson Distribution in Event Count & Uranium Discovery
Want To Learn More? To watch the entire video and ALL of the videos in the series:
full solution
Explore the dynamics of Poisson distribution using both theoretical understanding and a practical application related to discovering uranium deposits. With the help of Bayes' formula and parameter adjustments, interpret various probabilities and outcomes for event occurrences.
Sullivan's Algebra Scores: Frequency to Probabilities Analysis
Want To Learn More? To watch the entire video and ALL of the videos in the series:
full solution
Explore Sullivan’s College Algebra homework score analysis, from frequency distribution construction to in-depth statistical calculations such as standard deviation. Discover histogram visualizations, mean and median interpretations, and probability estimations for various score thresholds. Utilize Excel functions for precise calculations.
Analyzing Student Homework Times: Quartiles & Data Insights
Want To Learn More? To watch the entire video and ALL of the videos in the series:
full solution
Examine a dataset that tracks student homework durations. Understand quartiles, the interquartile range, and skewness in the data. Discover insights into typical study durations and outlier behaviors.