PreparED Study Materials
STAT 285: Statistics for Business
School: Rutgers University
Number of Notes and Study Guides Available: 15
Notes


Study Guides


Videos
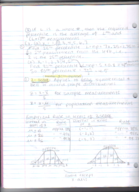
Committee Selection: Breaking Down Probabilities

Want To Learn More? To watch the entire video and ALL of the videos in the series:
full solution
Uncover the mathematical methods used to determine various probabilities when selecting committees. Utilize combination formulas and probabilities to evaluate different teacher-parent combinations.
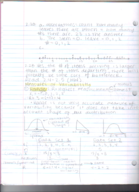
Evaluating Expressions Using a Set of Scores
Want To Learn More? To watch the entire video and ALL of the videos in the series:
full solution
Discover the methodology behind evaluating various mathematical expressions using a given set of scores. By interpreting and applying summation notation, learn how to compute the desired results from a set of numbers. Key conclusions showcase the step-by-step calculations and their significance.
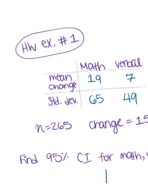
Calculating Confidence Interval for Educational TV Viewership
Want To Learn More? To watch the entire video and ALL of the videos in the series:
full solution
Learn how to determine a 90% confidence interval for the proportion of people who watch educational television based on a survey. Understand how to utilize the z-score and interpret results, guiding decisions for a television company's publicity efforts.
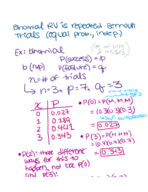
Probabilities with Poisson Variables X1 & X2
Want To Learn More? To watch the entire video and ALL of the videos in the series:
full solution
Explore the complexities of two independent Poisson random variables, X1 and X2, with means ?1 = 2 and ?2 = 3. Understand the process of calculating specific event probabilities and the application of the Poisson formula. Key takeaways include the manipulation and interpretation of these statistical values.
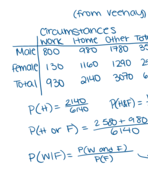
011 Car Colors in North America: Trends & Visual Insights
Want To Learn More? To watch the entire video and ALL of the videos in the series:
full solution
Discover the trends in car colors for North America in 2011. Break down the percentage distribution of various shades, from dominating whites to the less frequent greens. Understand the best visual techniques to represent this data, weighing the pros and cons of graphs.
Two-Sample T-Test: Analyzing Control vs. Supplemented Groups
Want To Learn More? To watch the entire video and ALL of the videos in the series:
full solution
Explore the steps to conduct a two-sample t-test using a control and supplemented group. Through hypothesis testing, standard deviation, and P-value interpretation, we analyze the means of both groups to determine statistical differences.