PreparED Study Materials

STAT 2820: Reasoning With Statistics
School: Appalachian State University
Number of Notes and Study Guides Available: 2
Notes

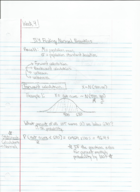
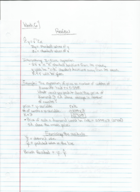
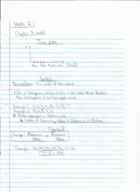
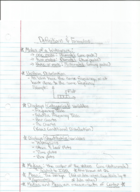
Stt 2820 ch 1 and ch 2 notes (Statistics)
STAT 2820
Appalachian State University
3 pages | Fall 2016

Videos
Analyzing Age Distribution of Proofreaders: A Statistical Approach

Want To Learn More? To watch the entire video and ALL of the videos in the series:
full solution
Discover the statistical process behind analyzing the age distribution of proofreaders at a publishing company. Learn how to use the Z-score formula for individual and sample mean probabilities, and how to interpret results using a Z-table.
Two-Sample T-Test: Analyzing Control vs. Supplemented Groups
Want To Learn More? To watch the entire video and ALL of the videos in the series:
full solution
Explore the steps to conduct a two-sample t-test using a control and supplemented group. Through hypothesis testing, standard deviation, and P-value interpretation, we analyze the means of both groups to determine statistical differences.
Electronic Failures: Deciding Between Minor & Major Defects Cost-Effec
Want To Learn More? To watch the entire video and ALL of the videos in the series:
full solution
Discover the intricacies of determining the cause of electronic system failures, either minor or major defects, using statistical distributions. Learn how to minimize the expected cost and make informed decisions based on soundings and loss tables
Comparing Plastic Gear Strengths: Supplier 1 vs. Supplier 2 Analysis
Want To Learn More? To watch the entire video and ALL of the videos in the series:
full solution
This video presents a comparison between two suppliers of plastic gears in terms of their mean impact strength. Using statistical tools like the two-sample t-test and confidence intervals, we evaluate which supplier offers stronger gears.
Probabilities with Poisson Variables X1 & X2
Want To Learn More? To watch the entire video and ALL of the videos in the series:
full solution
Explore the complexities of two independent Poisson random variables, X1 and X2, with means ?1 = 2 and ?2 = 3. Understand the process of calculating specific event probabilities and the application of the Poisson formula. Key takeaways include the manipulation and interpretation of these statistical values.
Which Confidence Level Produces the Widest Interval? Explained!
Want To Learn More? To watch the entire video and ALL of the videos in the series:
full solution
Uncover the relationship between confidence levels and interval widths. Grasp how the range of confidence intervals broadens with increasing confidence. Understand the trade-offs in statistical certainty and estimation.