PreparED Study Materials

EPID 201: Introduction to Statistics
School: University of Arizona
Number of Notes and Study Guides Available: 10
Study Guides


Videos
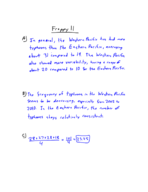
Chi-Square Observations: Probability of Exceeding 7.779

Want To Learn More? To watch the entire video and ALL of the videos in the series:
full solution
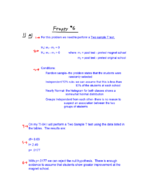
Discover how to compute the likelihood of observations exceeding a certain value in a chi-square distribution with 4 degrees of freedom. Using the binomial distribution formula, evaluate the chances of at most 3 out of 15 observations surpassing the 7.779 mark. Results highlight the intricacies of data distributions.
Comparing Stock Returns & Volatility: T-test and F-test Insights
Want To Learn More? To watch the entire video and ALL of the videos in the series:
full solution
Compare the mean returns and volatilities of two stocks using t-test and F-test methods. Through the application of hypothesis testing and P-value calculations, we determine which stock provides higher returns and which is riskier.
Real Cowboys' Lifespan: Debunking Wild West Myths
Want To Learn More? To watch the entire video and ALL of the videos in the series:
full solution
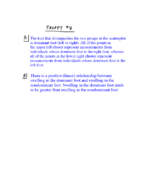
Explore the actual longevity of legendary cowboys using a detailed sociological study. With data visualization and historical references, challenge popular stereotypes and understand the reality of cowboy lives in the late 19th century.
Computing Probabilities: College Students & Computer Ownership
Want To Learn More? To watch the entire video and ALL of the videos in the series:
full solution
Understand the probabilities of computer ownership among university first-year students through various scenarios. This video breaks down calculations for chances of ownership and non-ownership among random groups.
Testing the 123-Gallon Daily Water Claim: Fact or Fiction?
Want To Learn More? To watch the entire video and ALL of the videos in the series:
full solution
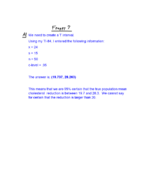
Explore the claim that average daily water consumption is 123 gallons. Using statistical testing, we evaluate a new sample against the Old Farmer’s Almanac claim. Learn how to interpret p-values and t-scores in hypothesis testing.
Predicting Preference: Using Binomial Distribution for a New Dairy For
Want To Learn More? To watch the entire video and ALL of the videos in the series:
full solution
Discover how the binomial distribution formula can predict the preference of judges for a new dairy drink formula. Understand the odds of different outcomes from unanimous approval to complete rejection. Dive into probability, expectations, and variance to decode consumer choices.