PreparED Study Materials

STAT 218: Applied Statistics for the Life Sciences
School: California Polytechnic State University - San Luis Obispo
Number of Notes and Study Guides Available: 1
Notes

Videos
Brand X vs. Brand Y: 95% Confidence in Voltage Difference

Want To Learn More? To watch the entire video and ALL of the videos in the series:
full solution
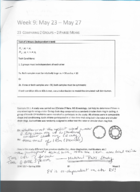
Compare the voltages of Brand X and Brand Y batteries using statistical analysis. Learn how to determine a 95% confidence interval for their mean differences. Understand the process from data collection to interpretation of results.
Want To Learn More? To watch the entire video and ALL of the videos in the series:
full solution
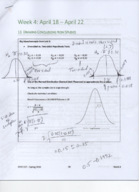
Poisson Analysis: Asthma ED Visits in Seattle
Want To Learn More? To watch the entire video and ALL of the videos in the series:
full solution
Unpack a Seattle-based study on Emergency Department asthma visits using the Poisson distribution. Explore the probability of visit frequencies and derive insights on healthcare patterns. Conclusions provide a statistical overview of asthma-related ED attendance.
Battery Lifetimes: Mean, Variance & Standard Deviation
Want To Learn More? To watch the entire video and ALL of the videos in the series:
full solution
Discover the nuances of analyzing battery lifetime data through mean, variance, and standard deviation computations. Using class boundaries, midpoints, and frequencies, gain insights into the dispersion of battery lifespans and the average deviation from the mean.
Comparing Plastic Gear Strengths: Supplier 1 vs. Supplier 2 Analysis
Want To Learn More? To watch the entire video and ALL of the videos in the series:
full solution
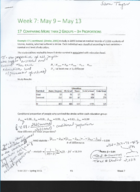
This video presents a comparison between two suppliers of plastic gears in terms of their mean impact strength. Using statistical tools like the two-sample t-test and confidence intervals, we evaluate which supplier offers stronger gears.
Young Adults' TV Habits: Decoding Mean and Probability
Want To Learn More? To watch the entire video and ALL of the videos in the series:
full solution
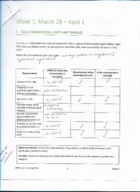
Discover how to determine the probability and mean of young adults watching TV in a week. Using provided data, we compare the sample mean with the calculated population mean to interpret expected TV viewing habits.