PreparED Study Materials

EPID 230: Psychological Measurements and Statistics
School: University of Arizona
Number of Notes and Study Guides Available: 0
Videos
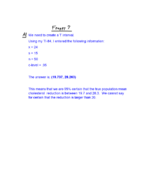
Young Adults' TV Habits: Decoding Mean and Probability

Want To Learn More? To watch the entire video and ALL of the videos in the series:
full solution
Discover how to determine the probability and mean of young adults watching TV in a week. Using provided data, we compare the sample mean with the calculated population mean to interpret expected TV viewing habits.
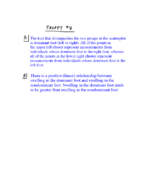
Evaluating Tornado Length Claims: A Statistical Breakdown
Want To Learn More? To watch the entire video and ALL of the videos in the series:
full solution
Explore a statistical approach to analyze the claim about average tornado lengths. Understand the nuances of hypothesis testing, from setting null and alternative hypotheses to interpreting P-values. Witness a comprehensive breakdown of the evidence from a sample of 500 tornadoes.
Predicting Preference: Using Binomial Distribution for a New Dairy For
Want To Learn More? To watch the entire video and ALL of the videos in the series:
full solution
Discover how the binomial distribution formula can predict the preference of judges for a new dairy drink formula. Understand the odds of different outcomes from unanimous approval to complete rejection. Dive into probability, expectations, and variance to decode consumer choices.
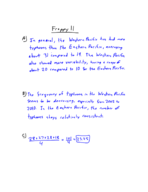
Analyzing Engineers' Graduate Plans: Fortune vs Engineering Horizons D
Want To Learn More? To watch the entire video and ALL of the videos in the series:
full solution
This video contrasts Fortune's claim about engineers pursuing further studies with data from Engineering Horizons. Utilizing hypothesis testing and confidence intervals, we assess the validity of Fortune's assertion within a statistical framework.
Chi-Square Observations: Probability of Exceeding 7.779
Want To Learn More? To watch the entire video and ALL of the videos in the series:
full solution
Discover how to compute the likelihood of observations exceeding a certain value in a chi-square distribution with 4 degrees of freedom. Using the binomial distribution formula, evaluate the chances of at most 3 out of 15 observations surpassing the 7.779 mark. Results highlight the intricacies of data distributions.
Calcium in Chautauqua's Rain: 1990 vs. 2010 Analysis
Want To Learn More? To watch the entire video and ALL of the videos in the series:
full solution
Explore the calcium concentration in Chautauqua's rainwater from 2010, comparing it to 1990 levels. Using statistical tests, examine normal distribution and determine significant changes. The results provide insights into environmental shifts over two decades.