PreparED Study Materials

EPID 276: Statistic Inference in Management
School: University of Arizona
Number of Notes and Study Guides Available: 7
Notes


Study Guides


Videos
Analyzing Teen Texting: Confidence Interval & Plausibility

Want To Learn More? To watch the entire video and ALL of the videos in the series:
full solution
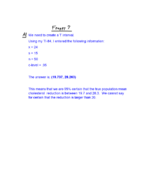
Discover how to calculate the 95% confidence interval for a population proportion using sample data. Through a practical example about texting habits among American teens, learn the implications of this statistical tool and how to assess plausibility.
Want To Learn More? To watch the entire video and ALL of the videos in the series:
full solution
Evaluating Expressions Using a Set of Scores
Want To Learn More? To watch the entire video and ALL of the videos in the series:
full solution
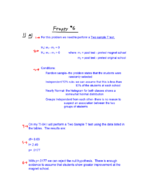
Discover the methodology behind evaluating various mathematical expressions using a given set of scores. By interpreting and applying summation notation, learn how to compute the desired results from a set of numbers. Key conclusions showcase the step-by-step calculations and their significance.
Lake Macatawa Bacteria: 90% Confidence Analysis
Want To Learn More? To watch the entire video and ALL of the videos in the series:
full solution
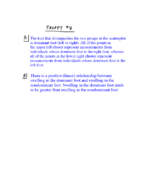
Discover the method to analyze bacteria colonies in Lake Macatawa's east basin. Using 30 samples, we compute a 90% confidence interval for the mean colony count. Learn the steps of statistical analysis in environmental studies.
Americans on Marriage: Statistical Insights from a Sample
Want To Learn More? To watch the entire video and ALL of the videos in the series:
full solution
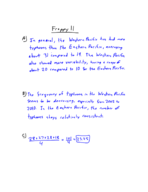
Review a Pew Research Center study on Americans' beliefs about marriage. Through statistical analysis, understand the sampling distribution, standard deviation, and the probabilities surrounding various beliefs. The insights detail public sentiments and the significance of sample outcomes.
Analyzing Student Homework Times: Quartiles & Data Insights
Want To Learn More? To watch the entire video and ALL of the videos in the series:
full solution
Examine a dataset that tracks student homework durations. Understand quartiles, the interquartile range, and skewness in the data. Discover insights into typical study durations and outlier behaviors.