PreparED Study Materials

STAT 1053: Introduction to Statistics in Social Science
School: George Washington University
Number of Notes and Study Guides Available: 54
Notes


Study Guides


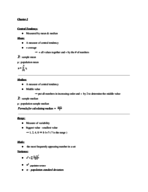
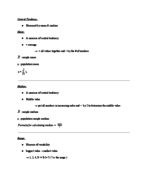
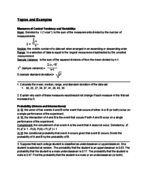

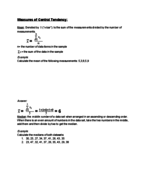
Stat 1053 - study guide #1 (Statistics)
STAT 1053
George Washington University
4 pages | Winter 2015
Videos
Football Field Goal Probabilities: A Multi-Player Analysis

Want To Learn More? To watch the entire video and ALL of the videos in the series:
full solution
Discover the art of calculating probabilities in football. Using three players' success rates, we determine the odds of different goal outcomes. Understand independent and mutually exclusive events in a real-world scenario.
Battery Lifetimes: Mean, Variance & Standard Deviation
Want To Learn More? To watch the entire video and ALL of the videos in the series:
full solution
Discover the nuances of analyzing battery lifetime data through mean, variance, and standard deviation computations. Using class boundaries, midpoints, and frequencies, gain insights into the dispersion of battery lifespans and the average deviation from the mean.
Evaluating Tornado Length Claims: A Statistical Breakdown
Want To Learn More? To watch the entire video and ALL of the videos in the series:
full solution
Explore a statistical approach to analyze the claim about average tornado lengths. Understand the nuances of hypothesis testing, from setting null and alternative hypotheses to interpreting P-values. Witness a comprehensive breakdown of the evidence from a sample of 500 tornadoes.
Evaluating Expressions Using a Set of Scores
Want To Learn More? To watch the entire video and ALL of the videos in the series:
full solution
Discover the methodology behind evaluating various mathematical expressions using a given set of scores. By interpreting and applying summation notation, learn how to compute the desired results from a set of numbers. Key conclusions showcase the step-by-step calculations and their significance.
Exit Poll Analysis: Education Funding Referendum Votes
Want To Learn More? To watch the entire video and ALL of the videos in the series:
full solution
Explore the application of proportion z-tests in analyzing exit polling data. Understand how to determine the likelihood of sample results given a population proportion. Recognize the importance of considering non-sampling errors in interpreting exit poll outcomes.
Sullivan's Algebra Scores: Frequency to Probabilities Analysis
Want To Learn More? To watch the entire video and ALL of the videos in the series:
full solution
Explore Sullivan’s College Algebra homework score analysis, from frequency distribution construction to in-depth statistical calculations such as standard deviation. Discover histogram visualizations, mean and median interpretations, and probability estimations for various score thresholds. Utilize Excel functions for precise calculations.