PreparED Study Materials

STAT 2112: Business and Economic Statistics II
School: George Washington University
Number of Notes and Study Guides Available: 5
Notes
Study Guides
Videos
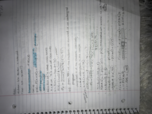
Poisson Distribution in Event Count & Uranium Discovery

Want To Learn More? To watch the entire video and ALL of the videos in the series:
full solution
Explore the dynamics of Poisson distribution using both theoretical understanding and a practical application related to discovering uranium deposits. With the help of Bayes' formula and parameter adjustments, interpret various probabilities and outcomes for event occurrences.
Understanding Mutually Exclusive Events: Real-life Scenarios
Want To Learn More? To watch the entire video and ALL of the videos in the series:
full solution
Explore the concept of mutually exclusive events in probability, using practical examples like rolling a die, selecting college students, and understanding political party registrations.
Football Field Goal Probabilities: A Multi-Player Analysis
Want To Learn More? To watch the entire video and ALL of the videos in the series:
full solution
Discover the art of calculating probabilities in football. Using three players' success rates, we determine the odds of different goal outcomes. Understand independent and mutually exclusive events in a real-world scenario.
Calculating Mean & Modal Class for Million-Dollar Bonuses
Want To Learn More? To watch the entire video and ALL of the videos in the series:
full solution
Learn how to determine the mean and modal class for bonuses in millions. Understand midpoint calculations and how frequencies impact results. Gain insights into bonus distributions in the financial realm.
Analyzing Voter Demographics: Independence & Exclusivity
Want To Learn More? To watch the entire video and ALL of the videos in the series:
full solution
Analyze the relationships between different political affiliations and age groups. Determine whether certain events are independent, mutually exclusive, or neither, based on the provided probabilities. The findings offer a nuanced understanding of voter demographics and their interdependencies.
Analyzing U.S. Teacher Salaries: Where Do You Stand?
Want To Learn More? To watch the entire video and ALL of the videos in the series:
full solution
Explore the salary distribution of U.S. teachers using statistical analysis. Understand the probabilities of different salary brackets and evaluate a potential job offer in the context of nationwide data.