PreparED Study Materials

STAT 1430: Statistics for the Business Sciences
School: Ohio State University
Number of Notes and Study Guides Available: 23
Notes


Study Guides


Business statistics exam 2 study guide (OTHER)
STAT 1430
Ohio State University
8 pages | Spring 2015


Videos
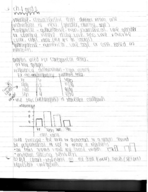
Sullivan's Algebra Scores: Frequency to Probabilities Analysis

Want To Learn More? To watch the entire video and ALL of the videos in the series:
full solution
Explore Sullivan’s College Algebra homework score analysis, from frequency distribution construction to in-depth statistical calculations such as standard deviation. Discover histogram visualizations, mean and median interpretations, and probability estimations for various score thresholds. Utilize Excel functions for precise calculations.
Traffic Light Wait Time: Using Probability to Decode Delays
Want To Learn More? To watch the entire video and ALL of the videos in the series:
full solution
Explore the mathematical intricacies behind calculating the waiting time for a motorist at traffic lights. Learn about normal random variables, conditional probabilities, and the challenges in determining specific waiting durations.
Thread Strength After Heat Treatment: A 99% Confidence Analysis"
Want To Learn More? To watch the entire video and ALL of the videos in the series:
full solution
Explore the impact of heat treatment duration on thread breaking strength. Using statistical analysis, we assess the difference in mean strengths between batches. Confidence intervals help quantify this difference with 99% certainty.
011 Car Colors in North America: Trends & Visual Insights
Want To Learn More? To watch the entire video and ALL of the videos in the series:
full solution
Discover the trends in car colors for North America in 2011. Break down the percentage distribution of various shades, from dominating whites to the less frequent greens. Understand the best visual techniques to represent this data, weighing the pros and cons of graphs.
Decoding Probabilities: Unions, Intersections, and Complements
Want To Learn More? To watch the entire video and ALL of the videos in the series:
full solution
Explore the intricacies of calculating probabilities using set theory concepts such as union and intersection. With step-by-step computations, understand how to find the likelihood of events A and B occurring or not occurring together. Witness the application of classic probabilistic formulas.
Understanding Mutually Exclusive Events: Real-life Scenarios
Want To Learn More? To watch the entire video and ALL of the videos in the series:
full solution
Explore the concept of mutually exclusive events in probability, using practical examples like rolling a die, selecting college students, and understanding political party registrations.


