PreparED Study Materials

STAT 420: Probability and Mathematical Statistics I
School: Colorado State University
Number of Notes and Study Guides Available: 0
Videos
011 Car Colors in North America: Trends & Visual Insights

Want To Learn More? To watch the entire video and ALL of the videos in the series:
full solution
Discover the trends in car colors for North America in 2011. Break down the percentage distribution of various shades, from dominating whites to the less frequent greens. Understand the best visual techniques to represent this data, weighing the pros and cons of graphs.
Comparing Ages: Slot Machine vs. Roulette Players
Want To Learn More? To watch the entire video and ALL of the videos in the series:
full solution
Examine the mean ages between two distinct groups: slot machine players and roulette enthusiasts. Utilizing the independent sample t-test, evaluate if there's a significant age difference between the two groups. The findings offer a nuanced understanding of player demographics in gaming environments.
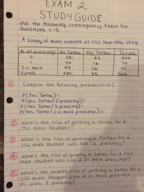
Analyzing Voter Demographics: Independence & Exclusivity
Want To Learn More? To watch the entire video and ALL of the videos in the series:
full solution
Analyze the relationships between different political affiliations and age groups. Determine whether certain events are independent, mutually exclusive, or neither, based on the provided probabilities. The findings offer a nuanced understanding of voter demographics and their interdependencies.
Analyzing Grade Variance: Is it More than Usual? A Chi-Square Test
Want To Learn More? To watch the entire video and ALL of the videos in the series:
full solution
Discover the process of analyzing variance in midterm grades with a Chi-Square test. Understand the significance of high variance and its implications. Follow along as we assess a professor's suspicion about unusually varied student performance.
Comparing Plastic Gear Strengths: Supplier 1 vs. Supplier 2 Analysis
Want To Learn More? To watch the entire video and ALL of the videos in the series:
full solution
This video presents a comparison between two suppliers of plastic gears in terms of their mean impact strength. Using statistical tools like the two-sample t-test and confidence intervals, we evaluate which supplier offers stronger gears.
Probabilities with Poisson Variables X1 & X2
Want To Learn More? To watch the entire video and ALL of the videos in the series:
full solution
Explore the complexities of two independent Poisson random variables, X1 and X2, with means ?1 = 2 and ?2 = 3. Understand the process of calculating specific event probabilities and the application of the Poisson formula. Key takeaways include the manipulation and interpretation of these statistical values.