Solution Found!

Solved: Shown are graphs of the position functions of two runners, A and B, who run a
Chapter 2, Problem 12(choose chapter or problem)
Shown are graphs of the position functions of two runners, A and B, who run a 100-meter race and finish in a tie. s (meters) 0 4 8 12 80 40 t (seconds) A B (a) Describe and compare how the runners run the race. (b) At what time is the distance between the runners the greatest? (c) At what time do they have the same velocity?
Questions & Answers
QUESTION:
Shown are graphs of the position functions of two runners, A and B, who run a 100-meter race and finish in a tie. s (meters) 0 4 8 12 80 40 t (seconds) A B (a) Describe and compare how the runners run the race. (b) At what time is the distance between the runners the greatest? (c) At what time do they have the same velocity?
ANSWER:Step 1 of 3
Shown are graphs of the position functions of two runners, A and B, who run a 100-meter race and finish in a tie.
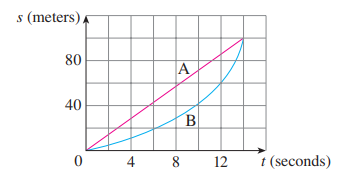
From the given graph it is seen that the runner runs a 100- meter race along a straight line.
So, the velocity of runner A is constant throughout the race.
The runner B follows a non-linear path. Therefore, the velocity of the runner throughout the whole race is not constant.