Solution Found!

Solved: Stats teachers cars A random sample of AP Statistics teachers was asked to
Chapter 12, Problem 17(choose chapter or problem)
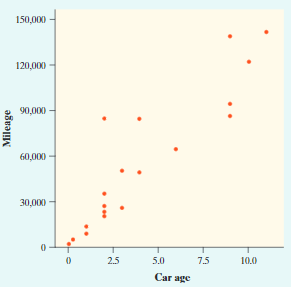
Stats teachers’ cars A random sample of AP® Statistics teachers was asked to report the age (in years) and mileage of their primary vehicles. A scatterplot of the data is shown at top right.
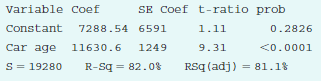
Computer output from a least-squares regression analysis of these data is shown below (df=19). Assume that the conditions for regression inference are met.
(a) Verify that the 95% confidence interval for the slope of the population regression line is (9016.4, 14,244.8).
(b) A national automotive group claims that the typical driver puts 15,000 miles per year on his or her main vehicle. We want to test whether AP® Statistics teachers are typical drivers. Explain why an appropriate pair of hypotheses for this test is \(H_{0}: \ \beta=15,000\) versus \(H_{a}: \ \beta \neq 15,000\)
(c) Compute the test statistic and P-value for the test in part (b). What conclusion would you draw at the \(\alpha=0.05\) significance level?
(d) Does the confidence interval in part (a) lead to the same conclusion as the test in part (c)? Explain.
Questions & Answers
QUESTION:
Stats teachers’ cars A random sample of AP® Statistics teachers was asked to report the age (in years) and mileage of their primary vehicles. A scatterplot of the data is shown at top right.
Computer output from a least-squares regression analysis of these data is shown below (df=19). Assume that the conditions for regression inference are met.
(a) Verify that the 95% confidence interval for the slope of the population regression line is (9016.4, 14,244.8).
(b) A national automotive group claims that the typical driver puts 15,000 miles per year on his or her main vehicle. We want to test whether AP® Statistics teachers are typical drivers. Explain why an appropriate pair of hypotheses for this test is \(H_{0}: \ \beta=15,000\) versus \(H_{a}: \ \beta \neq 15,000\)
(c) Compute the test statistic and P-value for the test in part (b). What conclusion would you draw at the \(\alpha=0.05\) significance level?
(d) Does the confidence interval in part (a) lead to the same conclusion as the test in part (c)? Explain.
ANSWER:Step 1 of 5
From the previous exercise, we have :
The sample size,

The slope is,

The standard error of the slope,