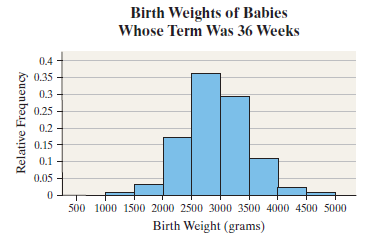
?In Problems 19–22, determine whether or not the histogram indicates that a normal distribution could be used as a model for the variable. Birth W
Chapter 7, Problem 19(choose chapter or problem)
In Problems 19–22, determine whether or not the histogram indicates that a normal distribution could be used as a model for the variable.
Birth Weights The relative frequency histogram represents the birth weights (in grams) of babies whose term was 36 weeks.
Unfortunately, we don't have that question answered yet. But you can get it answered in just 5 hours by Logging in or Becoming a subscriber.
Becoming a subscriber
Or look for another answer