?In Problems 3–6, use the results in the table to (a) draw a normal probability plot, (b) determine the linear correlation between the observed values
Chapter 7, Problem 3(choose chapter or problem)
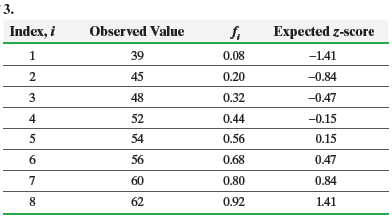
In Problems 3–6, use the results in the table to (a) draw a normal probability plot, (b) determine the linear correlation between the observed values and expected z-scores, (c) determine the critical value in Table VI to assess the normality of the data.
Unfortunately, we don't have that question answered yet. But you can get it answered in just 5 hours by Logging in or Becoming a subscriber.
Becoming a subscriber
Or look for another answer