FIGURE 2–36 is a position versus time graph for the motion
Chapter 25, Problem 56P(choose chapter or problem)
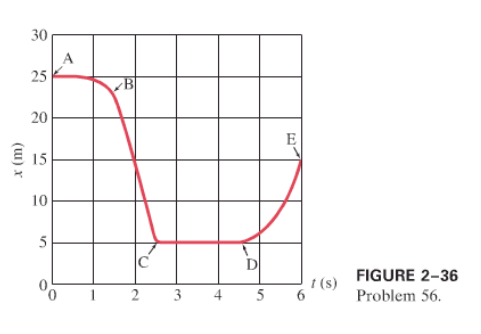
FIGURE 2–36 is a position versus time graph for the motion of an object along the x axis. Consider the time interval from A to B. (a) Is the object moving in the positive or negative direction? (b) Is the object speeding up or slowing down? (c) Is the acceleration of the object positive or negative? Now consider the time interval from D to E. (d) Is the object moving in the positive or negative direction? (e) Is the object speeding up or slowing down? (f) Is the acceleration of the object positive or negative? (g) Finally, answer these same three questions for the time interval from C to D.
Unfortunately, we don't have that question answered yet. But you can get it answered in just 5 hours by Logging in or Becoming a subscriber.
Becoming a subscriber
Or look for another answer