Figure 2–51 is a position versus time graph for the motion
Chapter 2, Problem 4SL(choose chapter or problem)
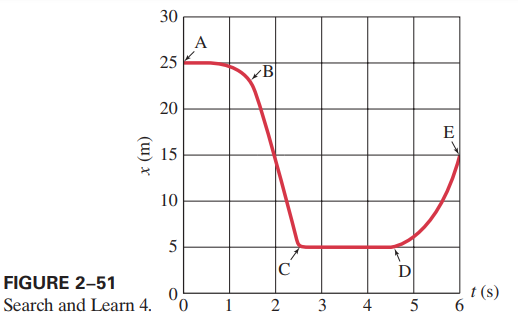
Figure 2–51 is a position versus time graph for the motion of an object along the axis. Consider the time interval from A to B. (
) Is the object moving in the positive or negative
direction? (
) Is the object speeding up or slowing down? (
) Is the acceleration of the object positive or negative? Now consider the time interval from D to E. (d) Is the object moving in the positive or negative
direction? (
) Is the object speeding up or slowing down? (f) Is the acceleration of the object positive or negative? (
) Finally, answer these same three questions for the time interval from C to D.
Equation Transcription:
Text Transcription:
x(m)
t(s)
Unfortunately, we don't have that question answered yet. But you can get it answered in just 5 hours by Logging in or Becoming a subscriber.
Becoming a subscriber
Or look for another answer