Solution Found!

An article in the Journal of Agricultural Science [“The
Chapter 8, Problem 21E(choose chapter or problem)
An article in the Journal of Agricultural Science [“The Use of Residual Maximum Likelihood to
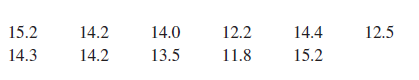
Model Grain Quality Characteristics of Wheat with Variety, Climatic and Nitrogen Fertilizer Effects” (1997, Vol. 128, pp. 135–142)] investigated means of wheat grain crude protein content \(\text { (CP) }\) and Hagberg falling number \(\text { (HFN) }\) surveyed in the United Kingdom. The analysis used a variety of nitrogen fertilizer applications \(\text { (kg N/ha) }\), temperature \(\left({ }^{\circ} \mathrm{C}\right)\), and total monthly rainfall \(\text { mm) }\). The following data below describe temperatures for wheat grown at Harper Adams Agricultural College between 1982 and 1993. The temperatures measured in June were obtained as follows:
Assume that the standard deviation is known to be \(\sigma=0.5\).
(a) Construct a \(99 \%\) two-sided confidence interval on the mean temperature.
(b) Construct a \(95 \%\) lower-confidence bound on the mean temperature.
(c) Suppose that you wanted to be \(95 \%\) confident that the error in estimating the mean temperature is less than 2 degrees Celsius. What sample size should be used?
(d) Suppose that you wanted the total width of the two-sided confidence interval on mean temperature to be 1.5 degrees Celsius at \(95 \%\) confidence. What sample size should be used?
Equation Transcription:
Text Transcription:
(CP)
(HFN)
(kg N/ha)
(°C)
(mm)
\sigma = 0.5
99%
95%
95%
95%
Questions & Answers
QUESTION:
An article in the Journal of Agricultural Science [“The Use of Residual Maximum Likelihood to
Model Grain Quality Characteristics of Wheat with Variety, Climatic and Nitrogen Fertilizer Effects” (1997, Vol. 128, pp. 135–142)] investigated means of wheat grain crude protein content \(\text { (CP) }\) and Hagberg falling number \(\text { (HFN) }\) surveyed in the United Kingdom. The analysis used a variety of nitrogen fertilizer applications \(\text { (kg N/ha) }\), temperature \(\left({ }^{\circ} \mathrm{C}\right)\), and total monthly rainfall \(\text { mm) }\). The following data below describe temperatures for wheat grown at Harper Adams Agricultural College between 1982 and 1993. The temperatures measured in June were obtained as follows:
Assume that the standard deviation is known to be \(\sigma=0.5\).
(a) Construct a \(99 \%\) two-sided confidence interval on the mean temperature.
(b) Construct a \(95 \%\) lower-confidence bound on the mean temperature.
(c) Suppose that you wanted to be \(95 \%\) confident that the error in estimating the mean temperature is less than 2 degrees Celsius. What sample size should be used?
(d) Suppose that you wanted the total width of the two-sided confidence interval on mean temperature to be 1.5 degrees Celsius at \(95 \%\) confidence. What sample size should be used?
Equation Transcription:
Text Transcription:
(CP)
(HFN)
(kg N/ha)
(°C)
(mm)
\sigma = 0.5
99%
95%
95%
95%
ANSWER:
Step 1 of 4
Given that,
The temperatures measured in June were obtained as follows:
15.2 14.2 14.0 12.2 14.4 12.5 14.3 14.2 13.5 11.8 15.2
The standard deviation is known to be 
(a)
The confidence level of 99% implies a significance level of 0.01.
A 99% two-sided confidence interval on the mean temperature is obtained as:

Computing the sample mean,

The two-tailed critical z-value at 0.01 significance level is:

So,

Therefore, the required confidence interval is 