Solution Found!

Solved: Consider the dissolved oxygen data in Exercise
Chapter 9, Problem 161SE(choose chapter or problem)
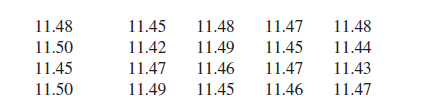
An article in Food Testing and Analysis [“Improving Reproducibility of Refractometry Measurements of Fruit Juices” (1999, Vol. 4(4), pp. 13–17)] measured the sugar concentration (Brix) in clear apple juice. All readings were taken at \(20^{\circ} \mathrm{C}\):
(a) Test the hypothesis \(\mathrm{H}_{0}: \mu=11.5\) versus \(\mathrm{H}_{1}: \mu \neq 11.5\) using \(\alpha=0.05\). Find the P-value.
(b) Compute the power of the test if the true mean is 11.4.
(c) What sample size would be required to detect a true mean sugar concentration of 11.45 if we wanted the power of the test to be at least 0.9?
(d) Explain how the question in part (a) could be answered by constructing a two-sided confidence interval on the mean sugar concentration.
(e) Is there evidence to support the assumption that the sugar concentration is normally distributed?
Equation Transcription:
Text Transcription:
20°C
H_0:\mu=11.5
H_1: \mu \neq 11.5
\alpha =0.05
P-value
Questions & Answers
QUESTION:
An article in Food Testing and Analysis [“Improving Reproducibility of Refractometry Measurements of Fruit Juices” (1999, Vol. 4(4), pp. 13–17)] measured the sugar concentration (Brix) in clear apple juice. All readings were taken at \(20^{\circ} \mathrm{C}\):
(a) Test the hypothesis \(\mathrm{H}_{0}: \mu=11.5\) versus \(\mathrm{H}_{1}: \mu \neq 11.5\) using \(\alpha=0.05\). Find the P-value.
(b) Compute the power of the test if the true mean is 11.4.
(c) What sample size would be required to detect a true mean sugar concentration of 11.45 if we wanted the power of the test to be at least 0.9?
(d) Explain how the question in part (a) could be answered by constructing a two-sided confidence interval on the mean sugar concentration.
(e) Is there evidence to support the assumption that the sugar concentration is normally distributed?
Equation Transcription:
Text Transcription:
20°C
H_0:\mu=11.5
H_1: \mu \neq 11.5
\alpha =0.05
P-value
ANSWER:Step 1 of 5
Given that,
The data showing the readings that were taken at 20°C is:
11.48 11.45 11.48 11.47 11.48
11.50 11.42 11.49 11.45 11.44
11.45 11.47 11.46 11.47 11.43
11.50 11.49 11.45 11.46 11.47
(a)
The null and the alternative hypotheses are:

It corresponds to a two-tailed test.
Suppose the level of significance is, 
The data shows the sample size of n = 20.
The sample mean is:

The sample standard deviation is,

Assuming the null hypothesis is true, the test statistic value is:

Computing the p-value associated with the t-value of -6.980and 20- 1 = 19 degrees of freedom is:

Since the p-value (0.000001) is less than the significance level of 0.05; therefore, the null hypothesis is rejected.