Solution Found!

An article in the IEEE Transactions on Instrumentation and
Chapter , Problem 97E(choose chapter or problem)
An article in the IEEE Transactions on Instrumentation and Measurement [“Direct, Fast, and Accurate Measurement of VT and K of MOS Transistor Using VT-Sift Circuit” (1991, Vol. 40, pp. 951–955)] described the use of a simple linear regression model to express drain current y (in milliamperes) as a function of ground-to-source voltage x (in volts). The data are as follows:

(a) Draw a scatter diagram of these data. Does a straight-line relationship seem plausible?
(b) Fit a simple linear regression model to these data.
(c) Test for significance of regression using \(\alpha=0.05\). What is the \(P-\text { value }\) for this test?
(d) Find a \(95 \% \) confidence interval estimate on the slope.
(e) Test the hypothesis \(H_{0}: \beta_{0}=0\) versus \(H_{1}: \beta_{0} \neq 0\) using \(\alpha=0.05\). What conclusions can you draw?
Equation Transcription:
Text Transcription:
\alpha=0.05
P-value
95%
H0:\beta 0=0
H1:\beta 0 \neq 0
\alpha=0.05
Questions & Answers
QUESTION:
An article in the IEEE Transactions on Instrumentation and Measurement [“Direct, Fast, and Accurate Measurement of VT and K of MOS Transistor Using VT-Sift Circuit” (1991, Vol. 40, pp. 951–955)] described the use of a simple linear regression model to express drain current y (in milliamperes) as a function of ground-to-source voltage x (in volts). The data are as follows:
(a) Draw a scatter diagram of these data. Does a straight-line relationship seem plausible?
(b) Fit a simple linear regression model to these data.
(c) Test for significance of regression using \(\alpha=0.05\). What is the \(P-\text { value }\) for this test?
(d) Find a \(95 \% \) confidence interval estimate on the slope.
(e) Test the hypothesis \(H_{0}: \beta_{0}=0\) versus \(H_{1}: \beta_{0} \neq 0\) using \(\alpha=0.05\). What conclusions can you draw?
Equation Transcription:
Text Transcription:
\alpha=0.05
P-value
95%
H0:\beta 0=0
H1:\beta 0 \neq 0
\alpha=0.05
ANSWER:
Problem 97SE
An article in the IEEE Transactions on Instrumentation and Measurement [“Direct, Fast, and Accurate Measurement of VT and K of MOS Transistor Using VT-Sift Circuit” (1991, Vol. 40, pp. 951–955)] described the use of a simple linear regression model to express drain current y (in milliamperes) as a function of ground-to-source voltage x (in volts). The data are as follows:

(a) Draw a scatter diagram of these data. Does a straight-line relationship seem plausible?
(b) Fit a simple linear regression model to these data.
(c) Test for significance of regression using 
(d) Find a 95% confidence interval estimate on the slope.
(e) Test the hypothesis 


Step by step solution
Step 1 of 5
a)
Construct scatter plot by using Minitab for the given data by using Minitab as follows:
Instructions:
* Enter data into Minitab worksheet
* Go to Graph 

* Enter Y and X variables, click OK.
The resultant scatter plot is as shown below:
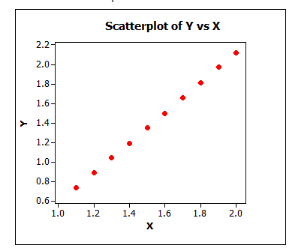
From the above plot, one can conclude that the data is perfectly positive correlated.