Solution Found!
The graph in Fig. describes the acceleration as a function
Chapter 2, Problem 62P(choose chapter or problem)
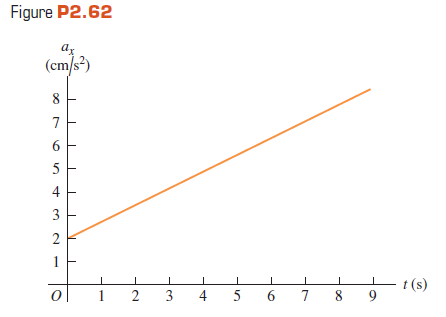
The graph in Fig. P2.62 describes the acceleration as a function of time for a stone rolling down a hill starting from rest.
(a) Find the stone’s velocity at \(𝑡 = t=2.5 \mathrm{~s} t=7.5 \mathrm{~s} \text {. }\)
(b) Sketch a graph of the stone’s velocity as a function of time.
Equation Transcription:
.5x
Text Transcription:
t=2.5s t=7.5x
Questions & Answers
QUESTION:
The graph in Fig. P2.62 describes the acceleration as a function of time for a stone rolling down a hill starting from rest.
(a) Find the stone’s velocity at \(𝑡 = t=2.5 \mathrm{~s} t=7.5 \mathrm{~s} \text {. }\)
(b) Sketch a graph of the stone’s velocity as a function of time.
Equation Transcription:
.5x
Text Transcription:
t=2.5s t=7.5x
ANSWER:Solution 62P
The change in speed is the area under the versus time curve between lines at t= 2.5 s and t=7.5 s.
The area is,A=