Blood is taken from each of n individuals to be tested for a certain disease. Rather than test each sample separately, a pooled method is used in an attempt to reduce the number of tests needed. Part of each blood sample is taken, and these parts are combined to form a pooled sample. The pooled sample is then tested. If the result is negative, then none of the n individuals has the disease, and no further tests are needed. If the pooled sample tests positive, then each individual is tested to see which of them have the disease. a. Let X represent the number of tests that are carried out. What are the possible values of X? b. Assume that \(n=4\) individuals are to be tested, and the probability that each has the disease, independent of the others, is \(p=0.1\). Find \(\mu_X\). c. Repeat part (b) with \(n=6\) and \(p=0.2\). d. Express \(\mu_X\) as a function of n and p. e. The pooled method is more economical than performing individual tests if \(\mu_X<n\). Suppose \(n=10\). For what values of p is the pooled method more economical than performing n individual tests? Equation Transcription: Text Transcription: n=4 p=0.1 mu_X n=6 p=0.2 mu_X mu_X<n n=10
Read moreTable of Contents
Textbook Solutions for Statistics for Engineers and Scientists
Question
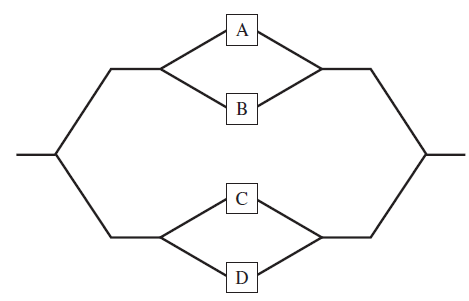
A system consists of four components connected as shown.
Assume A, B, C, and D function independently. If the probabilities that A, B, C, and D fail are 0.1, 0.2, 0.05, and 0.3, respectively, what is the probability that the system functions?
Solution
Solution :
Given, a system consists four component A,B,C and D.
From the given diagram
A be the event that component function is A.
B be the event that component function is B.
C be the event that component function is C and
D be the event that component function is D.
Here we assumed independently function is A,B,C and D.
Our goal is to find
a). What is the probability that the system functions?
Step 1 of 1 :
If the probability fails
A=0.1, B=0.2, C=0.05 and C=0.3.
Then,
full solution
A system consists of four components connected as shown.
Chapter 2 textbook questions
-
Chapter 2: Problem 35 Statistics for Engineers and Scientists 4
-
Chapter 2: Problem 1 Statistics for Engineers and Scientists 4
A system consists of four components connected as shown. Assume A, B, C, and D function independently. If the probabilities that A, B, C, and D fail are 0.1, 0.2, 0.05, and 0.3, respectively, what is the probability that the system functions?
Read more -
Chapter 2: Problem 3 Statistics for Engineers and Scientists 4
Silicon wafers are used in the manufacture of integrated circuits. Of the wafers manufactured by a certain process, 10% have resistances below specification and 5% have resistances above specification. a. What is the probability that the resistance of a randomly chosen wafer does not meet the specification? b. If a randomly chosen wafer has a resistance that does not meet the specification, what is the probability that it is too low?
Read more -
Chapter 2: Problem 4 Statistics for Engineers and Scientists 4
Two production lines are used to pack sugar into 5 kg bags. Line 1 produces twice as many bags as does line 2. One percent of the bags from line 1 are defective in that they fail to meet a purity specification, while 3% of the bags from line 2 are defective. A bag is randomly chosen for inspection. a. What is the probability that it came from line 1? b. What is the probability that it is defective? c. If the bag is defective, what is the probability that it came from line 1? d. If the bag is not defective, what is the probability that it came from line 1?
Read more -
Chapter 2: Problem 5 Statistics for Engineers and Scientists 4
Four bricks are sampled from a large load and the crushing strength of each is measured to determine whether it meets a specification. If any of the four fail to meet the specification, the load will be returned. If in fact 10% of the bricks in the load fail to meet the specification, what is the probability that the load will be returned?
Read more -
Chapter 2: Problem 2 Statistics for Engineers and Scientists 4
A fair coin is tossed until a head appears. What is the probability that more than three tosses are necessary?
Read more -
Chapter 2: Problem 6 Statistics for Engineers and Scientists 4
In a certain type of automobile engine, the cylinder head is fastened to the block by 10 bolts, each of which should be torqued to \(60 \mathrm{~N} \cdot \mathrm{m}\). Assume that the torques of the bolts are independent. a. If each bolt is torqued correctly with probability 0.99, what is the probability that all the bolts on a cylinder head are torqued correctly? b. The goal is for 95% of the engines to have all their bolts torqued correctly. What must be the probability that a bolt is torqued correctly in order to reach this goal? Equation Transcription: Text Transcription: 60 N{cdot}m
Read more -
Chapter 2: Problem 7 Statistics for Engineers and Scientists 4
An electronic message consists of a string of bits (0s and 1s). The message must pass through two relays before being received. At each relay the probability is 0.1 that the bit will be reversed before being relayed (i.e., a 1 will be changed to a 0, or a 0 to a 1). Find the probability that the value of a bit received at its final destination is the same as the value of the bit that was sent.
Read more -
Chapter 2: Problem 9 Statistics for Engineers and Scientists 4
Two dice are rolled. Given that two different numbers come up, what is the probability that one of the dice comes up 6?
Read more -
Chapter 2: Problem 10 Statistics for Engineers and Scientists 4
In a lot of 10 components, 2 are sampled at random for inspection. Assume that in fact exactly 2 of the 10 components in the lot are defective. Let X be the number of sampled components that are defective. a. Find \(P(X=0)\). b. Find \(P(X=1)\). c. Find \(P(X=2)\). d. Find the probability mass function of X. e. Find the mean of X. f. Find the standard deviation of X. Equation Transcription: Text Transcription: P(X=0) P(X=1) P(X=2)
Read more -
Chapter 2: Problem 11 Statistics for Engineers and Scientists 4
There are two fuses in an electrical device. Let X denote the lifetime of the first fuse, and let Y denote the lifetime of the second fuse (both in years). Assume the joint probability density function of X and Y is \(f(x, y)= \begin{cases}\frac{1}{6} e^{-x / 2-y / 3} & x>0 \text { and } y>0 \\ 0 & \text { otherwise }\end{cases}\) a. Find \(P(X \leq 2 \text { and } Y \leq 3)\). b. Find the probability that both fuses last at least 3 years. c. Find the marginal probability density function of X. d. Find the marginal probability density function of Y . e. Are X and Y independent? Explain. Equation Transcription: Text Transcription: f(x,y)={_0 otherwise^{1over 6}e^{-x/2-y/3} x>0 and y>0 P(X2 and Y3)
Read more -
Chapter 2: Problem 12 Statistics for Engineers and Scientists 4
Let A and B be events with \(P(A)=0.3\) and \(P(A\cup B)=0.7\). a. For what value of \(P(B)\) will A and B be mutually exclusive? b. For what value of \(P(B)\) will A and B be independent? Equation Transcription: Text Transcription: P(A)=0.3 P(AUB)=0.7 P(B) P(B)
Read more -
Chapter 2: Problem 8 Statistics for Engineers and Scientists 4
The reading given by a thermometer calibrated in ice water (actual temperature \(0^\circ \mathrm C\)) is a random variable with probability density function \(f(x)= \begin{cases}k\left(1-x^{2}\right) & -1<x<1 \\ 0 & \text { otherwise }\end{cases}\) where k is a constant. a. Find the value of k. b. What is the probability that the thermometer reads above \(0^\circ \mathrm C\)? c. What is the probability that the reading is within \(25^\circ \mathrm C\) of the actual temperature? d. What is the mean reading? e. What is the median reading? f. What is the standard deviation? Equation Transcription: Text Transcription: 0^oC f(x)={_0 otherwise ^k(1-x^2) -1<x<1 0^oC 0.25^oC
Read more -
Chapter 2: Problem 13 Statistics for Engineers and Scientists 4
A snowboard manufacturer has three plants, one in the eastern United States, one in the western United States, and one in Canada. Production records show that the U.S. plants each produced 10,000 snowboards last month, while the Canadian plant produced 8000 boards. Of all the boards manufactured in Canada last month, 4% had a defect that caused the boards to delaminate prematurely. Records kept at the U.S. plants show that 3% of the boards manufactured in the eastern United States and 6% of the boards manufactured in the western United States had this defect as well. a. What proportion of the boards manufactured last month were defective? b. What is the probability that a snowboard is defective and was manufactured in Canada? c. Given that a snowboard is defective, what is the probability that it was manufactured in the United States?
Read more -
Chapter 2: Problem 15 Statistics for Engineers and Scientists 4
Six new graduates are hired by an engineering firm. Each is assigned at random to one of six cubicles arranged in a row in the back of the room that houses the engineering staff. Two of the graduates are Bill and Cathy. What is the probability that they are assigned adjacent cubicles?
Read more -
Chapter 2: Problem 14 Statistics for Engineers and Scientists 4
The article “Traps in Mineral Valuations—Proceed With Care” (W. Lonegan, Journal of the Australasian Institute of Mining and Metallurgy, 2001:18–22) models the value (in millions of dollars) of a mineral deposit yet to be mined as a random variable X with probability mass function \(p(x)\) given by \(p(10)=0.40\), \(p(60)=0.50\), \(p(80) = 0.10\), and \(p(x)=0\) for values of x other than 10, 60, or 80. a. Is this article treating the value of a mineral deposit as a discrete or a continuous random variable? b. Compute \(\mu_X\). c. Compute \(\sigma_X\). d. The project will be profitable if the value is more than $50 million. What is the probability that the project is profitable? Equation Transcription: Text Transcription: p(x) p(10)=0.40 p(60)=0.50 p(80)=0.10 p(x)=0 mu_X sigma_X
Read more -
Chapter 2: Problem 16 Statistics for Engineers and Scientists 4
A closet contains four pairs of shoes. If four shoes are chosen at random, what is the probability that the chosen shoes do not contain a pair?
Read more -
Chapter 2: Problem 17 Statistics for Engineers and Scientists 4
Let X and Y be independent random variables with \(\mu_X=2\), \(\sigma_X=1\), \(\mu_Y=2\), and \(\sigma_Y=3\). Find the means and variances of the following quantities. a. \(3X\) b. \(X+Y\) c. \(X?Y\) d. \(2X+6Y\) Equation Transcription: Text Transcription: mu_X=2 sigma_X=1 mu_Y=2 sigma_Y=3 3X X+Y X-Y 2X+6Y
Read more -
Chapter 2: Problem 18 Statistics for Engineers and Scientists 4
Let X and Y be random variables with \(\mu_X=1\), \(\sigma_X=2\), \(\mu_X=3\), \(\sigma_Y=1\), and \(\rho_{X,Y}=0.5\). Find the means and variances of the following quantities. a. \(X+Y\) b. \(X?Y\) c. \(3X+2Y\) d. \(5Y?2X\) Equation Transcription: Text Transcription: mu_X=1 sigma_X=2 mu_Y=3 sigma_Y=1 rho_{X,Y}=0.5 X+Y X?Y 3X+2Y 5Y?2X
Read more -
Chapter 2: Problem 19 Statistics for Engineers and Scientists 4
A steel manufacturer is testing a new additive for manufacturing an alloy of steel. The joint probability mass function of tensile strength (in thousands of pounds/in2) and additive concentration is a. What are the marginal probability mass functions for X (additive concentration) and Y (tensile strength)? b. Are X and Y independent? Explain. c. Given that a specimen has an additive concentration of 0.04, what is the probability that its strength is 150 or more? d. Given that a specimen has an additive concentration of 0.08, what is the probability that its tensile strength is greater than 125? e. A certain application calls for the tensile strength to be 175 or more. What additive concentration should be used to make the probability of meeting this specification the greatest?
Read more -
Chapter 2: Problem 20 Statistics for Engineers and Scientists 4
Refer to Exercise 19. a. Find \(\mu_{X}\). b. Find \(\mu_{Y}\). c. Find \(\sigma_{X}\). d. Find \(\sigma_{Y}\). e. Find \(\operatorname{Cov}(X, Y)\). f. Find \(\rho_{X, Y}\). Equation Transcription: Text Transcription: mu_X mu_Y sigma_X sigma_Y Cov(X,Y) rho_{X,Y}
Read more -
Chapter 2: Problem 22 Statistics for Engineers and Scientists 4
A certain plant runs three shifts per day. Of all the items produced by the plant, 50% of them are produced on the first shift, 30% on the second shift, and 20% on the third shift. Of all the items produced on the first shift, 1% are defective, while 2% of the items produced on the second shift and 3% of the items produced on the third shift are defective. a. An item is sampled at random from the day’s pro- duction, and it turns out to be defective. What is the probability that it was manufactured during the first shift? b. An item is sampled at random from the day’s production, and it turns out not to be defective. What is the probability that it was manufactured during the third shift?
Read more -
Chapter 2: Problem 21 Statistics for Engineers and Scientists 4
Refer to Exercise 19. a. Compute the conditional mass function \(p_{Y \mid X}(y \mid 0.06)\). b. Compute the conditional mass function \(p_{X \mid Y}(x \mid 100) \). c. Compute the conditional expectation \(E(Y \mid X=0.06)\). d. Compute the conditional expectation \(E(X \mid Y=100)\). Equation Transcription: Text Transcription: p_{Y|X}(y|0.06) p_{X|Y}(x|100) E(Y|X=0.06) E(X|Y=100)
Read more -
Chapter 2: Problem 24 Statistics for Engineers and Scientists 4
Refer to Exercise 23. Assume that the probabilities that each of the three scenarios occurs are \(P(A)=0.20\), \(P(B) = 0.30\), and \(P(C) = 0.50\). a. Find the probability that scenario A occurs and that the loss is 5%. b. Find the probability that the loss is 5%. c. Find the probability that scenario A occurs given that the loss is 5%. Equation Transcription: Text Transcription: P(A)=0.20 P(B)=0.30 P(C)=0.50
Read more -
Chapter 2: Problem 25 Statistics for Engineers and Scientists 4
A box contains four 75 W light bulbs, three 60 W light bulbs, and three burned-out lightbulbs. Two bulbs are selected at random from the box. Let X represent the number of 75 W bulbs selected, and let Y represent the number of 60 W bulbs selected. a. Find the joint probability mass function of X and Y . b. Find \(\mu_{X}\). c. Find \(\mu_{Y}\). d. Find \(\sigma_{X}\). e. Find \(\sigma_{Y}\). f. Find \(\operatorname{Cov}(X, Y)\). g. Find \(\rho_{X, Y}\). Equation Transcription: Text Transcription: mu_X mu_Y sigma_X sigma_Y Cov(X,Y) rho_{X,Y}
Read more -
Chapter 2: Problem 23 Statistics for Engineers and Scientists 4
The article “Uncertainty and Climate Change” (G. Heal and B. Kristr ?om, Environmental and Re- source Economics, 2002:3–39) considers three scenarios, labeled A, B, and C, for the impact of global warming on income. For each scenario, a probability mass function for the loss of income is specified. These are presented in the following table. a. Compute the mean and standard deviation of the loss under scenario A. b. Compute the mean and standard deviation of the loss under scenario B. c. Compute the mean and standard deviation of the loss under scenario C. d. Under each scenario, compute the probability that the loss is less than 10%.
Read more -
Chapter 2: Problem 26 Statistics for Engineers and Scientists 4
A stock solution of hydrochloric acid (HCl) supplied by a certain vendor contains small amounts of several impurities, including copper and nickel. Let X denote the amount of copper and let denote the amount of nickel, in parts per ten million, in a randomly selected bottle of solution. Assume that the joint probability density function of and is given by \(f(x, y)= \begin{cases}c(x+y)^{2} & 0<x<1 \text { and } 0<y<1 \\ 0 & \text { otherwise }\end{cases}\) a. Find the value of the constant so that \(f(x,y)\) is a joint density function. b. Compute the marginal density function \(f_X(x)\). c. Compute the conditional density function \(f_{Y \mid X}(y \mid x)\). d. Compute the conditional expectation \(E(Y \mid X=0.4)\). e. Are and independent? Explain. Equation Transcription: Text Transcription: (HCl) f(x,y)={_0 otherwise ^c(x+y)^2 0<x<1 and 0<y<1 f(x,y) f_X(x) f_Y|X(y|x) E(Y|X=0.4)
Read more -
Chapter 2: Problem 27 Statistics for Engineers and Scientists 4
Refer to Exercise 26. a. Find \(\mu_{X}\). b. Find \(\sigma_{X}^{2}\). c. Find \(\operatorname{Cov}(X, Y)\). d. Find \(\rho_{X, Y}\). Equation Transcription: Text Transcription: mu_X Sigma sub X^2 Cov(X,Y) Rho X,Y
Read more -
Chapter 2: Problem 28 Statistics for Engineers and Scientists 4
A fair coin is tossed five times. Which sequence is more likely, HTTHH or HHHHH? Or are they equally likely? Explain.
Read more -
Chapter 2: Problem 29 Statistics for Engineers and Scientists 4
A penny and a nickel are tossed. The penny has probability 0.4 of coming up heads, and the nickel has probability 0.6 of coming up heads. Let \(X = 1\) if the penny comes up heads, and let \(X= 0\) if the penny comes up tails. Let \(Y = 1\) if the nickel comes up heads, and let \(Y = 0\) if the nickel comes up tails. a. Find the probability mass function of X. b. Find the probability mass function of Y . c. Is it reasonable to assume that X and Y are independent? Why? d. Find the joint probability mass function of X and Y . Equation Transcription: Text Transcription: X=1 X=0 Y=1 Y=0
Read more -
Chapter 2: Problem 31 Statistics for Engineers and Scientists 4
A box contains three cards, labeled 1, 2, and 3. Two cards are chosen at random, with the first card being replaced before the second card is drawn. Let X represent the number on the first card, and let Y represent the number on the second card. a. Find the joint probability mass function of X and Y . b. Find the marginal probability mass functions \(p_{X}(x)\) and \(p_{Y}(y)\). c. Find \(\mu_{X}\) and \(\mu_{Y}\). d. Find \(\mu_{X Y}\) . e. Find \(\operatorname{Cov}(X, Y)\). Equation Transcription: Text Transcription: p_X(x) p_Y(y) mu_X mu_Y XY Cov(X,Y)
Read more -
Chapter 2: Problem 30 Statistics for Engineers and Scientists 4
Two fair dice are rolled. Let X represent the number on the first die, and let Y represent the number on the second die. Find \(\mu_{X Y}\). Equation Transcription: Text Transcription: mu_{XY}
Read more -
Chapter 2: Problem 32 Statistics for Engineers and Scientists 4
Refer to Exercise 31. Assume the first card is not replaced before the second card is drawn. a. Find the joint probability mass function of X and Y . b. Find the marginal probability mass functions \(p_{X}(x)\) and \(p_{Y}(y)\). c. Find \(\mu_{X}\) and \(\mu_{Y}\). d. Find \(\mu_{X Y}\). e. Find \(\operatorname{Cov}(X, Y)\). Equation Transcription: Text Transcription: p_X(x) p_Y(y) mu_X mu_Y mu_XY Cov(X,Y)
Read more -
Chapter 2: Problem 33 Statistics for Engineers and Scientists 4
This exercise will lead you through a proof of Chebyshev's inequality. Let \(X\) be a continuous random variable with probability density function \(f(x)\). Suppose that \(P(X<0)=0\), so \(f(x)=0\) for \(x \leq 0\). a. Show that \(\mu_{X}=\int_{0}^{\infty} x f(x) d x\). b. Let \(k>0\) be a constant. Show that \(\mu_{X} \geq \int_{k}^{\infty} k f(x) d x=k P(X \geq k)\). c. Use part (b) to show that \(P(X \geq k) \leq \mu_{X} / k\). This is called Markov's inequality. It is true for discrete as well as for continuous random variables. d. Let \(Y\) be any random variable with mean \(\mu_{Y}\) and variance \(\sigma_{Y}^{2}\). Let \(X=\left(Y-\mu_{Y}\right)^{2}\). Show that \(\mu_{X}=\sigma_{Y}^{2}\). e. Let be \(k>0\) a constant. Show that \(P\left(\left|Y-\mu_{Y}\right| \geq k \sigma_{Y}\right)=P\left(X \geq k^{2} \sigma_{Y}^{2}\right)\) f. Use part (e) along with Markov's inequality to prove Chebyshev's inequality: \(P\left(\left|Y-\mu_{Y}\right| \geq k \sigma_{Y}\right) \leq 1 / k^{2}\) Equation Transcription: Text Transcription: X f(x) P(X<0)=0 f(x)=0 x leq 0 muX=integral_0^ infinity xf(x)dx mu_X geq integral_k^ infinity kf(x)dx=kP(X qec k) P(X gec k)lec mu_X/k Y mu_Y sigma_Y^2 X=(Y-mu_Y)^2 mu_X=sigma_Y^2 P(|Y-mu_Y| gec k sigma_Y)=P(X gec k^2 sigma_Y^2) P(|Y-mu_Y|gec k sigma_Y) lec 1/k^2
Read more -
Chapter 2: Problem 34 Statistics for Engineers and Scientists 4
A circle is drawn with radius , where \(\mu_{R}=10\) and \(\sigma_{R}^{2}=1\). The area of the circle is \(A=\pi R^{2}\). Find \(\mu_{A}\). Equation Transcription: Text Transcription: mu_R=10 sigma_R^2=1 A={pi}R^2 mu_A
Read more