The table lists the U.S. media rights fees (in millions of
Chapter 1, Problem 55(choose chapter or problem)
The table lists the U.S. media rights fees \(y\) (in millions of dollars) for the Summer Olympics in year \(t\), where t = 4 corresponds to 1984. (Source: 2012 Olympics Media Guide, NBC Sports Group)
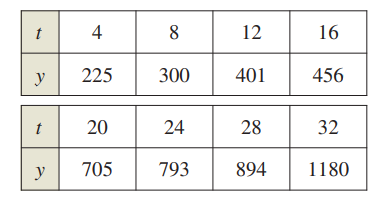
(a) Use the regression capabilities of a graphing utility to find a quadratic model for the data.
(b) Use a graphing utility to plot the data and graph the model. How well does the model fit the data? Explain your reasoning.
Text Transcription:
y
t
Unfortunately, we don't have that question answered yet. But you can get it answered in just 5 hours by Logging in or Becoming a subscriber.
Becoming a subscriber
Or look for another answer