Solution Found!
In a study of ground motion caused by earthquakes, the
Chapter 7, Problem 6E(choose chapter or problem)
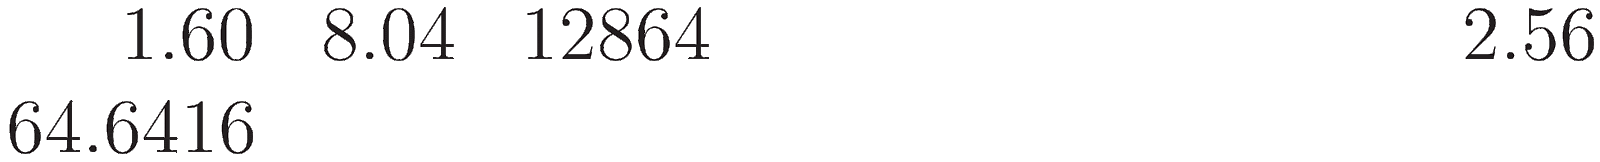
In a study of ground motion caused by earthquakes, the peak velocity (in m/s) and peak acceleration (in \(\mathrm {m/s}^2\)) were recorded for five earthquakes. The results are presented in the following table.

a. Compute the correlation coefficient between peak velocity and peak acceleration.
b. Construct a scatterplot for these data.
c. Is the correlation coefficient an appropriate summary for these data? Explain why or why not.
d. Someone suggests converting the units from meters to centimeters and from seconds to minutes. What effect would this have on the correlation?
Equation Transcription:
Text Transcription:
m/s^2
Questions & Answers
QUESTION:
In a study of ground motion caused by earthquakes, the peak velocity (in m/s) and peak acceleration (in \(\mathrm {m/s}^2\)) were recorded for five earthquakes. The results are presented in the following table.
a. Compute the correlation coefficient between peak velocity and peak acceleration.
b. Construct a scatterplot for these data.
c. Is the correlation coefficient an appropriate summary for these data? Explain why or why not.
d. Someone suggests converting the units from meters to centimeters and from seconds to minutes. What effect would this have on the correlation?
Equation Transcription:
Text Transcription:
m/s^2
ANSWER:Step 1 of 5