Solution Found!
Solved: The article “Drift in Posturography Systems
Chapter 7, Problem 6E(choose chapter or problem)
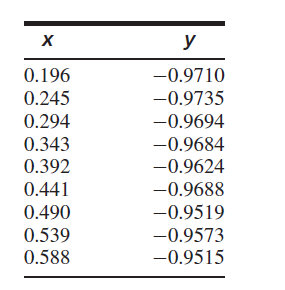
The article “Drift in Posturography Systems Equipped with a Piezoelectric Force Platform: Analysis and Numerical Compensation” (L. Quagliarella, N. Sasanelli, and V. Monaco, IEEE Transactions on Instrumentation and Measurement, 2008:997–1004) reported the results of an experiment to determine the effect of load on the drift in signals derived from a piezoelectric force plate. The correlation coefficient y between output and time was computed for various loads x in kN, as shown in the following table.
a. Compute the least-squares line for predicting y from x.
b. Plot the residuals versus the fitted values. Does the least-squares line seem appropriate?
c. Compute the least-squares line for predicting y from \(x^2\).
d. Plot the residuals versus the fitted values. Does the least-squares line seem appropriate?
e. For each model, find a 95% confidence interval for the mean value of y when \(x=0.32\). Are the confidence intervals similar?
Equation Transcription:
Text Transcription:
x^2
x=0.32
Questions & Answers
QUESTION:
The article “Drift in Posturography Systems Equipped with a Piezoelectric Force Platform: Analysis and Numerical Compensation” (L. Quagliarella, N. Sasanelli, and V. Monaco, IEEE Transactions on Instrumentation and Measurement, 2008:997–1004) reported the results of an experiment to determine the effect of load on the drift in signals derived from a piezoelectric force plate. The correlation coefficient y between output and time was computed for various loads x in kN, as shown in the following table.
a. Compute the least-squares line for predicting y from x.
b. Plot the residuals versus the fitted values. Does the least-squares line seem appropriate?
c. Compute the least-squares line for predicting y from \(x^2\).
d. Plot the residuals versus the fitted values. Does the least-squares line seem appropriate?
e. For each model, find a 95% confidence interval for the mean value of y when \(x=0.32\). Are the confidence intervals similar?
Equation Transcription:
Text Transcription:
x^2
x=0.32
ANSWER:
Step 1 of 10
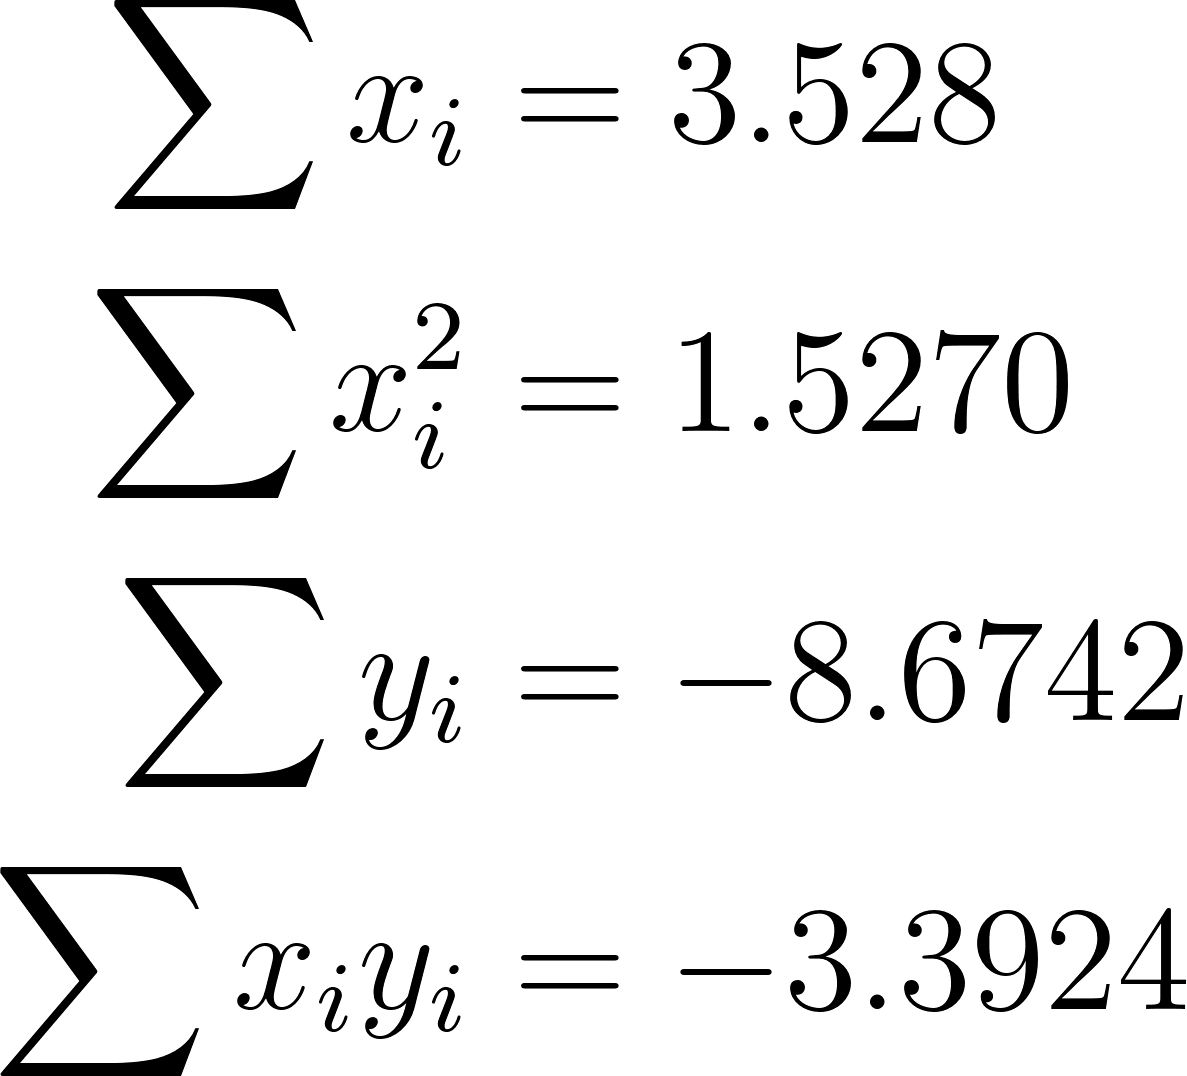
(a) Given:

Let us first determine the necessary sums: