
In Exercises 1522, graph each hyperbola. Locate the foci and fi nd the equations of the asymptotes. x2 16 - y2 = 1
Read moreTable of Contents
0
P.3
P.4
P.5
P.6
P.7
P.8
P.9
1.1
Graphs and Graphing Utilities
1.10
Graphs and Graphing Utilities
1.2
Basics of Functions and Their Graphs
1.3
More on Functions and Their Graphs
1.4
Linear Functions and Slope
1.5
More on Slope
1.6
Transformations of Functions
1.7
Combinations of Functions; Composite Functions
1.8
Inverse Functions
1.9
Distance and Midpoint Formulas; Circles
2
Polynomial and Rational Functions
2.1
Complex Numbers
2.2
Quadratic Functions
2.3
Polynomial Functions and Their Graphs
2.4
Dividing Polynomials; Remainder and Factor Theorems
2.5
Zeros of Polynomial Functions
2.6
Rational Functions and Their Graphs
2.7
Polynomial and Rational Inequalities
2.8
Modeling Using Variation
3
Exponential and Logarithmic Functions
3.1
Exponential Functions
3.2
Logarithmic Functions
3.3
Properties of Logarithms
3.4
Exponential and Logarithmic Equations
3.5
Exponential Growth and Decay; Modeling Data
4.1
Angles and Radian Measure
4.2
Trigonometric Functions: The Unit Circle
4.3
Right Triangle Trigonometry
4.4
Trigonometric Functions of Any Angle
4.5
Graphs of Sine and Cosine Functions
4.6
Graphs of Other Trigonometric Functions
4.7
Inverse Trigonometric Functions
4.8
Applications of Trigonometric Functions
5.1
Verifying Trigonometric Identities
5.2 and 5.3
5.4
Product-to-Sum and Sum-to-Product Formulas
5.5
Trigonometric Equations
6.1 and 6.2
6.3 and 6.4
6.5
Complex Numbers in Polar Form; DeMoivre’s Theorem
6.6
Vectors
6.7
The Dot Product
7.1
Systems of Linear Equations in Two Variables
7.2
Systems of Linear Equations in Three Variables
7.3
Partial Fractions
7.4
Systems of Nonlinear Equations in Two Variables
7.5
Systems of Inequalities
7.6
Linear Programming
8.1
Matrix Solutions to Linear Systems
8.2
Inconsistent and Dependent Systems and Their Applications
8.3
Matrix Operations and Their Applications
8.4
Multiplicative Inverses of Matrices and Matrix Equations
8.5
Determinants and Cramer’s Rule
9.1
The Ellipse
9.2
The Hyperbola
9.3
The Parabola
9.4
Rotation of Axes
9.5
Parametric Equations
9.6
Conic Sections in Polar Coordinates
10.1
Sequences and Summation Notation
10.2
Arithmetic Sequences
10.3
Geometric Sequences and Series
10.4
Mathematical Induction
10.5
The Binomial Theorem
10.6
Counting Principles, Permutations, and Combinations
10.7
Probability
11.1
Finding Limits Using Tables and Graphs
11.2
Finding Limits Using Properties of Limits
11.3
Limits and Continuity
11.4
Introduction to Derivatives
Textbook Solutions for Precalculus
Chapter 9.2 Problem 26
Question
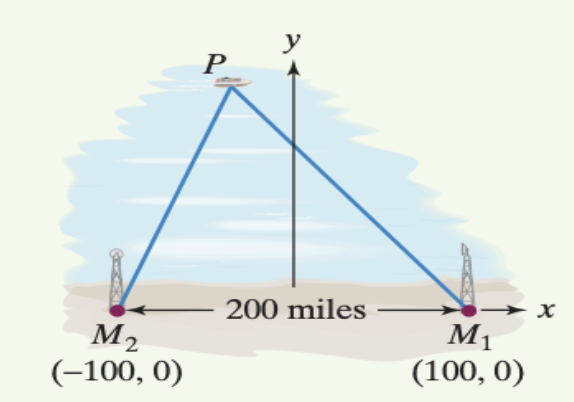
Radio tower \(M_{2}\) is located 200 miles due west of radio tower \(M_{1}\). The situation is illustrated in the fi gure shown, where a coordinate system has been superimposed. Simultaneous radio signals are sent from each tower to a ship, with the signal from \(M_{2}\) received 500 microseconds before the signal from \(M_{1}\). Assuming that radio signals travel at 0.186 mile per microsecond, determine the equation of the hyperbola on which the ship is located.
Solution
Step 1 of 3
Suppose \(M_{1}\) and \(M_{2}\) are foci of the hyperbola.
From the figure we can see
\(c=100\)
Given
Radio signal speed \(=0.186\) mile per microseconds
\(M_{2}\) received the signal 500 milliseconds before \(M_{1}\)
Subscribe to view the
full solution
full solution
Title
Precalculus 5
Author
Rober F. Blitzer
ISBN
9780321837349
Radio tower M2 is located 200 miles due west of radio
Chapter 9.2 textbook questions
-
Chapter 9: Problem 15 Precalculus 5
-
Chapter 9: Problem 16 Precalculus 5
In Exercises 1522, graph each hyperbola. Locate the foci and fi nd the equations of the asymptotes. y2 16 - x2 = 1
Read more -
Chapter 9: Problem 17 Precalculus 5
In Exercises 1522, graph each hyperbola. Locate the foci and fi nd the equations of the asymptotes. 9x2 - 16y2 = 144
Read more -
Chapter 9: Problem 18 Precalculus 5
In Exercises 1522, graph each hyperbola. Locate the foci and fi nd the equations of the asymptotes. 4y2 - x2 = 16
Read more -
Chapter 9: Problem 19 Precalculus 5
In Exercises 1522, graph each hyperbola. Locate the foci and fi nd the equations of the asymptotes. (x - 2)2 25 - (y + 3)2 16 = 1
Read more -
Chapter 9: Problem 20 Precalculus 5
In Exercises 1522, graph each hyperbola. Locate the foci and fi nd the equations of the asymptotes. (y + 2)2 25 - (x - 3)2 16 = 1
Read more -
Chapter 9: Problem 21 Precalculus 5
In Exercises 1522, graph each hyperbola. Locate the foci and fi nd the equations of the asymptotes. y2 - 4y - 4x2 + 8x - 4 = 0
Read more -
Chapter 9: Problem 22 Precalculus 5
In Exercises 1522, graph each hyperbola. Locate the foci and fi nd the equations of the asymptotes. x2 - y2 - 2x - 2y - 1 = 0
Read more -
Chapter 9: Problem 23 Precalculus 5
In Exercises 2324, fi nd the standard form of the equation of each hyperbola satisfying the given conditions. Foci: (0, -4), (0, 4); Vertices: (0, -2), (0, 2)
Read more -
Chapter 9: Problem 24 Precalculus 5
In Exercises 2324, fi nd the standard form of the equation of each hyperbola satisfying the given conditions. Foci: (-8, 0), (8, 0); Vertices: (-3, 0), (3, 0)
Read more -
Chapter 9: Problem 25 Precalculus 5
Explain why it is not possible for a hyperbola to have foci at (0, -2) and (0, 2) and vertices at (0, -3) and (0, 3)
Read more -
Chapter 9: Problem 26 Precalculus 5
Radio tower M2 is located 200 miles due west of radio tower M1. The situation is illustrated in the fi gure shown, where a coordinate system has been superimposed. Simultaneous radio signals are sent from each tower to a ship, with the signal from M2 received 500 microseconds before the signal from M1. Assuming that radio signals travel at 0.186 mile per microsecond, determine the equation of the hyperbola on which the ship is located
Read more