Solution Found!
A linear dynamic model of the -subsystem of a
Chapter 8, Problem 69(choose chapter or problem)
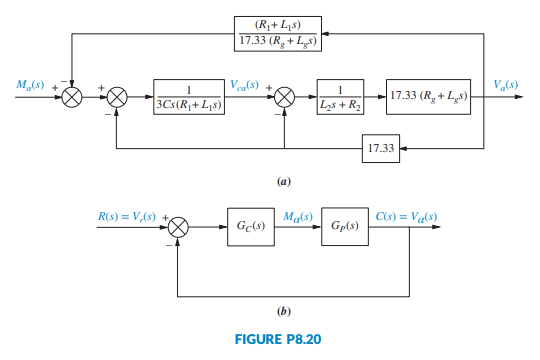
A linear dynamic model of the \(\alpha\)-subsystem of a grid connected voltage-source converter (VSC) using a Y-Y transformer is shown in Figure P8.20(a) (Mahmood, 2012). Here, C = \(135 \mu \mathrm{F}\), \(R_1\) = 0.016 \(\Omega\), \(L_1\) = 0.14 mH, \(R_2\) = 0.014 \(\Omega\), \(L_2\) = 10 \(\mu \mathrm{H}\), \(R_g\) = 1.1 \(\Omega\), and \(L_g\) = 0.5 mH.
a. Find the transfer function \(G_P(s)\) = \(\frac{V_a(s)}{M_a(s)}\).
b. If \(G_P(s)\) is the plant in MATLAB Figure P8.20 (b) and \(G_C(s)\) = K, use MATLAB to plot the root locus. On a closeup of the locus (from -300 to 0 on the real axis and from -50 to 5000 on the imaginary axis), find K and the coordinates of the dominant poles, which correspond to \(\zeta\) = 0.012. Plot the output response, c(t) = \(v_a(t)\), at that value of the gain when a step input, r(t) = \(v_r(t)\) = 208 u(t) volts, is applied at t = 0. Mark on the time response graph, c(t), all relevant characteristics, such as the percent overshoot, peak time, rise time, settling time, and final steady-state value.
Questions & Answers
QUESTION:
A linear dynamic model of the \(\alpha\)-subsystem of a grid connected voltage-source converter (VSC) using a Y-Y transformer is shown in Figure P8.20(a) (Mahmood, 2012). Here, C = \(135 \mu \mathrm{F}\), \(R_1\) = 0.016 \(\Omega\), \(L_1\) = 0.14 mH, \(R_2\) = 0.014 \(\Omega\), \(L_2\) = 10 \(\mu \mathrm{H}\), \(R_g\) = 1.1 \(\Omega\), and \(L_g\) = 0.5 mH.
a. Find the transfer function \(G_P(s)\) = \(\frac{V_a(s)}{M_a(s)}\).
b. If \(G_P(s)\) is the plant in MATLAB Figure P8.20 (b) and \(G_C(s)\) = K, use MATLAB to plot the root locus. On a closeup of the locus (from -300 to 0 on the real axis and from -50 to 5000 on the imaginary axis), find K and the coordinates of the dominant poles, which correspond to \(\zeta\) = 0.012. Plot the output response, c(t) = \(v_a(t)\), at that value of the gain when a step input, r(t) = \(v_r(t)\) = 208 u(t) volts, is applied at t = 0. Mark on the time response graph, c(t), all relevant characteristics, such as the percent overshoot, peak time, rise time, settling time, and final steady-state value.
Step 1 of 4
Given data:
A linear dynamic model of the \(\alpha\) subsystem of a grid-connected voltage source converter using a Y-Y transformer is given as,

The values are given as \(C = 135\;\mu F,{R_1} = 0.016\;\Omega ,{L_1} = 0.14\;{\rm{mH,}}{R_2} = 0.014\;\Omega ,{L_2} = 10\;{\rm{mH,}}{R_g} = 1.1\;\Omega ,{L_g} = 0.5\;{\rm{mH}}\).