Solution Found!
The open-loop frequency response shown in Figure P10.8 was
Chapter 10, Problem 27(choose chapter or problem)
QUESTION:
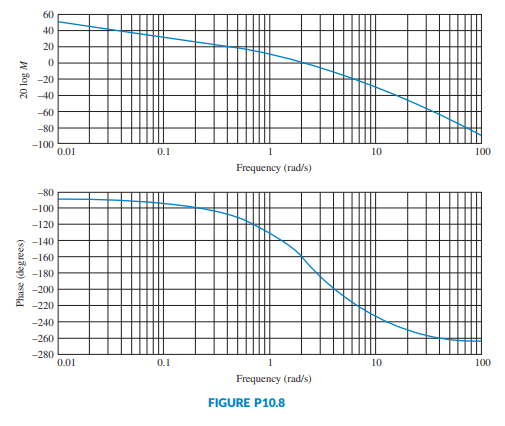
The open-loop frequency response shown in Figure P10.8 was experimentally obtained from a unity feedback system. Estimate the percent overshoot and steady-state error of the closed-loop system. [Sections: 10.10, 10.11]

Questions & Answers
QUESTION:
The open-loop frequency response shown in Figure P10.8 was experimentally obtained from a unity feedback system. Estimate the percent overshoot and steady-state error of the closed-loop system. [Sections: 10.10, 10.11]
Step 1 of 3
Given data:
The open-loop frequency response shown in Figure P10.8 was experimentally obtained from a unity feedback system as,