Solution Found!
Researchers interested in the relationship between
Chapter , Problem 8.4(choose chapter or problem)
Researchers interested in the relationship between absenteeism from school and certain demographic characteristics of children collected data from 146 randomly sampled students in rural New South Wales, Australia, in a particular school year. Below are three observations from this data set.
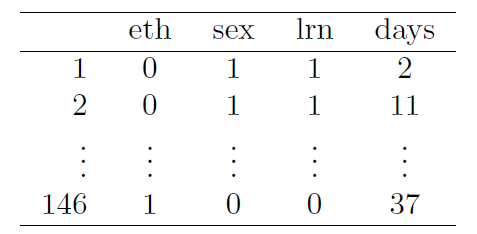
The summary table below shows the results of a linear regression model for predicting the average number of days absent based on ethnic background (eth: 0 - aboriginal, 1 - not aboriginal), sex (sex: 0 - female, 1 - male), and learner status (lrn: 0 - average learner, 1 - slow learner).18

(a) Write the equation of the regression line.
(b) Interpret each one of the slopes in this context.
(c) Calculate the residual for the first observation in the data set: a student who is aboriginal, male, a slow learner, and missed 2 days of school.
(d) The variance of the residuals is 240.57, and the variance of the number of absent days for all students in the data set is 264.17. Calculate the $$R^2$$ and the adjusted $$R^2$$. Note that there are 146 observations in the data set.
Questions & Answers
QUESTION:
Researchers interested in the relationship between absenteeism from school and certain demographic characteristics of children collected data from 146 randomly sampled students in rural New South Wales, Australia, in a particular school year. Below are three observations from this data set.
The summary table below shows the results of a linear regression model for predicting the average number of days absent based on ethnic background (eth: 0 - aboriginal, 1 - not aboriginal), sex (sex: 0 - female, 1 - male), and learner status (lrn: 0 - average learner, 1 - slow learner).18
(a) Write the equation of the regression line.
(b) Interpret each one of the slopes in this context.
(c) Calculate the residual for the first observation in the data set: a student who is aboriginal, male, a slow learner, and missed 2 days of school.
(d) The variance of the residuals is 240.57, and the variance of the number of absent days for all students in the data set is 264.17. Calculate the $$R^2$$ and the adjusted $$R^2$$. Note that there are 146 observations in the data set.
ANSWER:Step 1 of 6
Given,
Sample size, n = 146.
Using the summary table which shows the results of a regression model for predicting the average number of days absent based on ethnic background, let’s determine the following