Solution Found!
Solved: Time in bankruptcy. Refer to the Financial
Chapter , Problem 84E(choose chapter or problem)
Time in bankruptcy. Refer to the Financial Management (Spring 1995) study of 49 firms filing for a prepackaged bankruptcy, Exercise 2.32 (p. 62). Data on the variable of interest, and length of time (months) in bankruptcy for each firm, are saved in the accompanying file.
a. Construct a histogram for the 49 bankruptcy times. Comment on whether the Empirical Rule is applicable for describing the bankruptcy time distribution for firms filing for a prepackaged bankruptcy.
b. Find numerical descriptive statistics for the data set. Use this information to construct an interval that captures at least 75% of the bankruptcy times.
c. Count the number of the 49 bankruptcy times that fall within the interval, part b, and convert the result to a percentage. Does the result agree with Chebyshev’s Rule? The Empirical Rule?
d. A firm is considering filing a prepackaged bankruptcy plan. Estimate the length of time the firm will be in bankruptcy.
Questions & Answers
QUESTION:
Time in bankruptcy. Refer to the Financial Management (Spring 1995) study of 49 firms filing for a prepackaged bankruptcy, Exercise 2.32 (p. 62). Data on the variable of interest, and length of time (months) in bankruptcy for each firm, are saved in the accompanying file.
a. Construct a histogram for the 49 bankruptcy times. Comment on whether the Empirical Rule is applicable for describing the bankruptcy time distribution for firms filing for a prepackaged bankruptcy.
b. Find numerical descriptive statistics for the data set. Use this information to construct an interval that captures at least 75% of the bankruptcy times.
c. Count the number of the 49 bankruptcy times that fall within the interval, part b, and convert the result to a percentage. Does the result agree with Chebyshev’s Rule? The Empirical Rule?
d. A firm is considering filing a prepackaged bankruptcy plan. Estimate the length of time the firm will be in bankruptcy.
ANSWER:Step 1 of 4
(a)
Refer to the Study of 49 firms filing for prepackaged bankruptcy in Exercise 2.32 Data on the variable of interest, a length of time (in months) in bankruptcy for each firm is given in the table.
|
Reorganizing Plan |
Time in Bankruptcy (months) |
|
None |
3.9 10.1 4.1 3.0 3.2 4.2 2.9 2.4 7.8 2.6 2.4 |
|
Prepack |
1.5 1.0 1.9 1.3 4.1 1.1 1.0 3.8 1.0 1.5 1.0 1.4 1.2 3.0 1.6 1.4 1.1 1.2 1.5 2.1 1.4 1.7 1.4 2.7 1.2 4.1 2.9 |
|
Joint |
1.4 1.2 1.2 1.5 1.4 5.2 4.5 2.1 3.9 1.4 5.4 |
We need to construct a histogram for the 49 bankruptcy times and also we need to comment on whether the empirical rule is applicable for describing the bankruptcy time distribution.
Step to create the Histogram in Minitab:
- On the opening of Minitab, you will get session handler and worksheet like Excel worksheet.
- Enter the data into the worksheet (in this case time).
- After entering the data go to a menu called Graph in menu panel.
- In the Graph menu select option Histogram, you will get one window of Histogram.
- Under the Histogram window, and select the simple graph option.
- After doing this, you will get another which will contain all the variables you have entered in the worksheet.
- Select the time variable as Graph variables.
- After everything entered correctly, press ok and you will get the Histogram of your data.
- Right click on the graph you have just created and select the copy graph option.
- Use the graph according to your requirement.
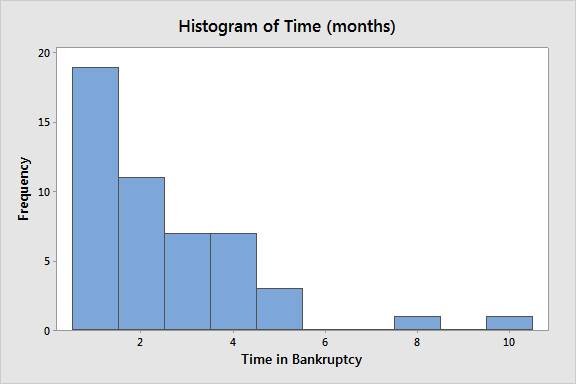
Figure 1: The frequency histogram for the time in bankruptcy (in months)
Empirical Rule:
For a distribution of measurements that is approximately normal distributed, it follows,
\(\mu \pm \sigma\) contains approximately 68% of the measurements.
\(\mu \pm 2 \sigma\) contains approximately 95% of the measurements.
\(\mu \pm 3 \sigma\) contains almost all of the measurements.
From the figure 1, we can see that the bankruptcy time distribution is not a bell shape or mound shape because our distribution is not a symmetric one.
Hence the Empirical Rule is not applicable here.