Solution Found!
Sweetness of orange juice The quality of the orange juice
Chapter 11, Problem 22E(choose chapter or problem)
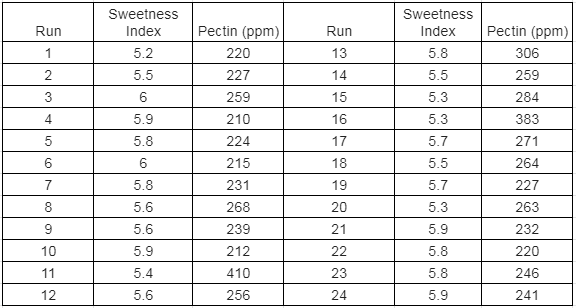
Sweetness of orange juice The quality of the orange juice produced by a manufacturer (e.g., Minute Maid, Tropicana) is constantly monitored. There are numerous sensory and chemical components that combine to make the best-tasting orange juice. For example, one manufacturer has developed a quantitative index of the “sweetness” of orange juice. (The higher the index, the sweeter the juice.) Is there a relationship between the sweetness index and a chemical measure such as the amount of water-soluble pectin (parts per million) in the orange juice? Data collected on these two variables for 24 production runs at a juice manufacturing plant are shown in the table below. Suppose a manufacturer wants to use simple linear regression to predict the sweetness (y) from the amount of pectin (x).
a. Find the least squares line for the data.
b. What do β0 and β1 represent in the words of the problem?
c. Predict the sweetness index if amount of pectin in the orange juice is 300 ppm.
d. Find the values of SSE, s2, and s for this regression.
e. Explain why it is difficult to give a practical interpretation to s2.
f. Give a practical interpretation of the value of s.
g. Use the results of the regression to form a 95% confidence interval for the slope, β1.
h. Find and interpret the coefficient of determination, r2, and the coefficient of correlation, r.
i. A 90% confidence interval for the predicted value of mean sweetness index, E(y), for run 1 is (5.649,5.838). What does this interval mean in terms of the problem?
Questions & Answers
QUESTION:
Sweetness of orange juice The quality of the orange juice produced by a manufacturer (e.g., Minute Maid, Tropicana) is constantly monitored. There are numerous sensory and chemical components that combine to make the best-tasting orange juice. For example, one manufacturer has developed a quantitative index of the “sweetness” of orange juice. (The higher the index, the sweeter the juice.) Is there a relationship between the sweetness index and a chemical measure such as the amount of water-soluble pectin (parts per million) in the orange juice? Data collected on these two variables for 24 production runs at a juice manufacturing plant are shown in the table below. Suppose a manufacturer wants to use simple linear regression to predict the sweetness (y) from the amount of pectin (x).
a. Find the least squares line for the data.
b. What do β0 and β1 represent in the words of the problem?
c. Predict the sweetness index if amount of pectin in the orange juice is 300 ppm.
d. Find the values of SSE, s2, and s for this regression.
e. Explain why it is difficult to give a practical interpretation to s2.
f. Give a practical interpretation of the value of s.
g. Use the results of the regression to form a 95% confidence interval for the slope, β1.
h. Find and interpret the coefficient of determination, r2, and the coefficient of correlation, r.
i. A 90% confidence interval for the predicted value of mean sweetness index, E(y), for run 1 is (5.649,5.838). What does this interval mean in terms of the problem?
ANSWER:
Step 1 of 3
(a)
Let the random variable x be the amount of pectin.
Let the random variable y be the sweetness index.
The sample mean of x is,

The sample mean of y is,

The sum of squares is,


The slope of the regression line is,

The y-intercept of regression line is,

The simple linear regression model is,

Therefore, the estimated simple linear regression equation is,
\
