Solution Found!
Contamination from a plant’s discharge. Refer to the U.S.
Chapter 12, Problem 18E(choose chapter or problem)
Problem 18E
Contamination from a plant’s discharge. Refer to the U.S. Army Corps of Engineers data (Example 1.5, p. 13) on fish contaminated from the toxic discharges of a chemical plant located on the banks of the Tennessee River in Alabama. Recall that the engineers measured the length (in centimeters), weight (in grams), and DDT level (in parts per million) for 144 captured fish. In addition, the number of miles upstream from the river was recorded. The data are saved in the file. (The first and last five observations are shown in the table in the next column.)
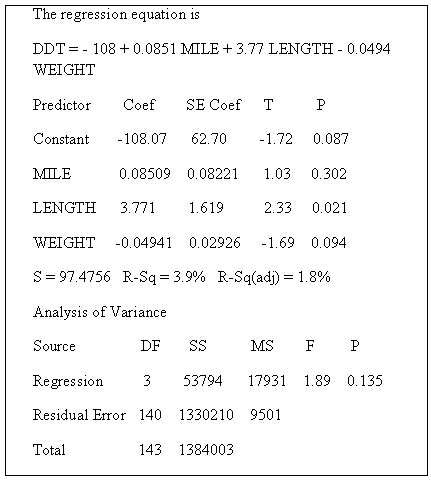
a. Fit the first-order model, E(y) = β0 + β1x1 + β2x2 + β3x3, to the data, where y = DDT level, x1 = mile, x2 = length, and x3 = weight. Report the least squares prediction equation.
b. Find the estimate of the standard deviation of e for the model and give a practical interpretation of its value.
c. Conduct a test of the global utility of the model. Use α = .05.

d. Do the data provide sufficient evidence to conclude that DDT level increases as length increases? Report the observed significance level of the test and reach a conclusion using α = .05.
e. Find and interpret a 95% confidence interval for β3.

Questions & Answers
QUESTION:
Problem 18E
Contamination from a plant’s discharge. Refer to the U.S. Army Corps of Engineers data (Example 1.5, p. 13) on fish contaminated from the toxic discharges of a chemical plant located on the banks of the Tennessee River in Alabama. Recall that the engineers measured the length (in centimeters), weight (in grams), and DDT level (in parts per million) for 144 captured fish. In addition, the number of miles upstream from the river was recorded. The data are saved in the file. (The first and last five observations are shown in the table in the next column.)
a. Fit the first-order model, E(y) = β0 + β1x1 + β2x2 + β3x3, to the data, where y = DDT level, x1 = mile, x2 = length, and x3 = weight. Report the least squares prediction equation.
b. Find the estimate of the standard deviation of e for the model and give a practical interpretation of its value.
c. Conduct a test of the global utility of the model. Use α = .05.
d. Do the data provide sufficient evidence to conclude that DDT level increases as length increases? Report the observed significance level of the test and reach a conclusion using α = .05.
e. Find and interpret a 95% confidence interval for β3.
ANSWER:
Step 1 of 6
By using Minitab, the analysis of the DDT level model is as follows
Results for: DDT.MTW
Regression Analysis: DDT versus MILE, LENGTH, WEIGHT